Several factors imply U.S. stocks may have made an important top.
The 30 – minute S&P 500 (SPX) chart courtesy of Trading View illustrates the intraday action since late March 2026.
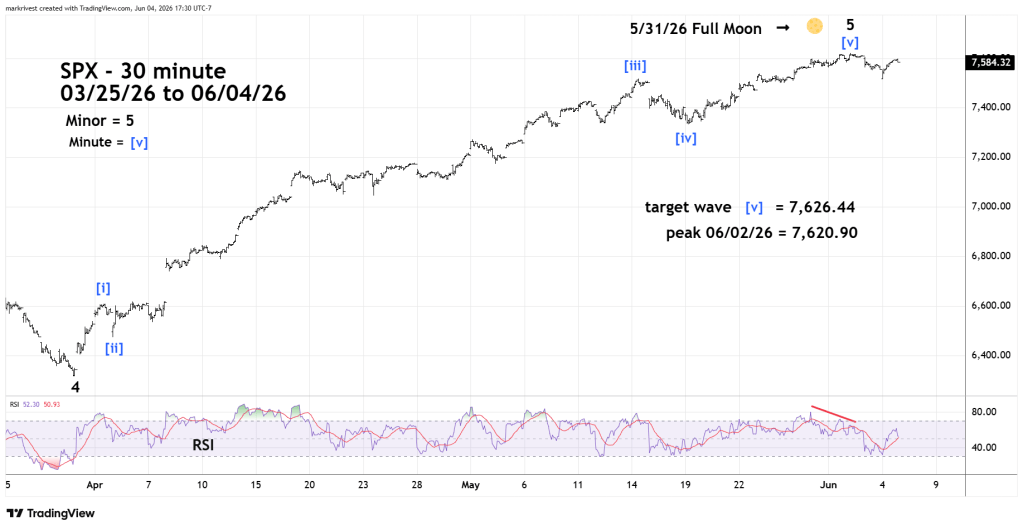
The 05/31/26 blog “S&P 500 – Upside Target – June 2026” illustrated potential Fibonacci resistance at 7,626.44, the high on 06/02/26 was 7,620.90.
Sometimes markets turn on Full/New Moons plus or minus two trading days. There was a Full Moon on Sunday 05/31/26. On 06/02/26 two of the main U.S. stock indices, SPX and Nasdaq Composite (IXIC) peaked within the lunar time zone.
On 06/02/26 – SPX – 30 – minute RSI had a double bearish divergence.
The daily Dow Jones Industrial Average (DJI) chart shows its momentum as of 06/04/26.
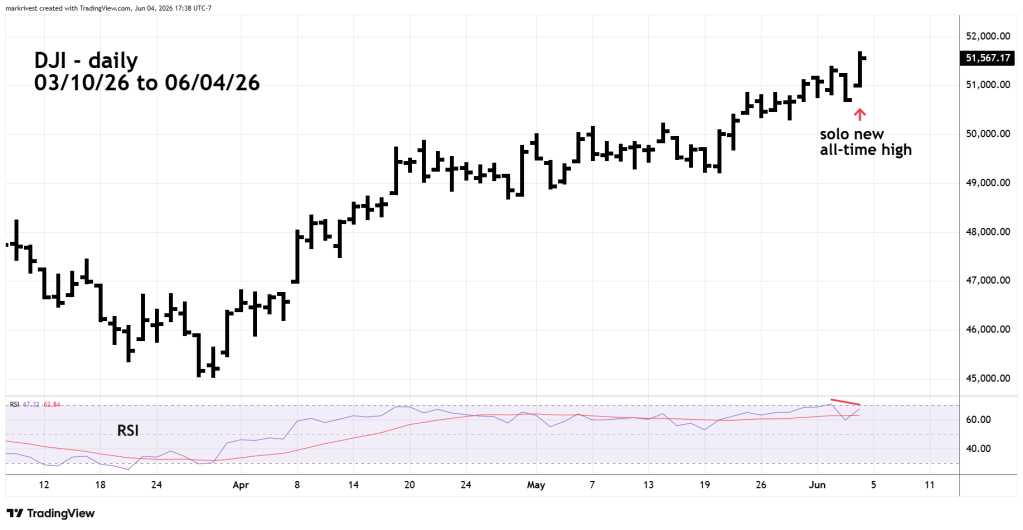
Since January 2000 several important U.S. stock market peaks have occurred with only one of the three main U.S. stock indices; SPX, DJI, and IXIC making a new all-time high.
On 06/04/26 DJI made a solo all-time high. This peak occurred with a bearish daily RSI divergence.
There’s a high probability U.S. stocks have begun at least a multi- week decline.
Important SPX support is the weekly low at 7,499.72. A break of this level opens the door for a move down to 7,333.68 – the preceding weekly bottom.
