The drop in U.S. stocks on 06/05/26 implies a multi-week may have begun. If so, where are near-term support levels?
The weekly S&P 500 (SPX) chart courtesy of Trading View provides clues.
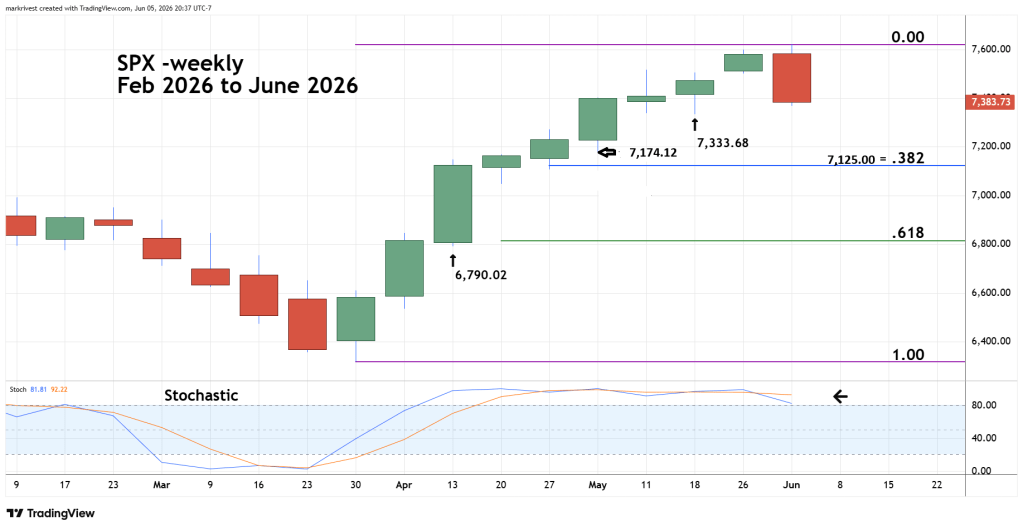
The starting point for market/stock analysis is segmentation. In this case the most significant segment is the 03/30/26 to 06/02/26 rally. A combination of Fibonacci analysis and the Strat method can identify potential support zones.
A Fibonacci .382 retracement of the March to June rally is at approximately 7,125.00.
In the Strat method a move above/below the prior price bar opens the door to the next prior price bar high/low.
The action of the weekly 06/01/26 to 06/05/26 price bar went below the prior weekly price bar. The next downside target is 7,333.68, a break at this level opens the door for a move to the next prior weekly low at 7,174.12.
A potentially significant support zone is 7,125 to 7174.
A break below this zone could trigger a move down to the Fibonacci .618 retracement level near 6,800.00
The catalyst for the large U.S. stock decline was a selloff in the technology sector.
The weekly Micron Technologies Inc. (MU) chart updates its action.
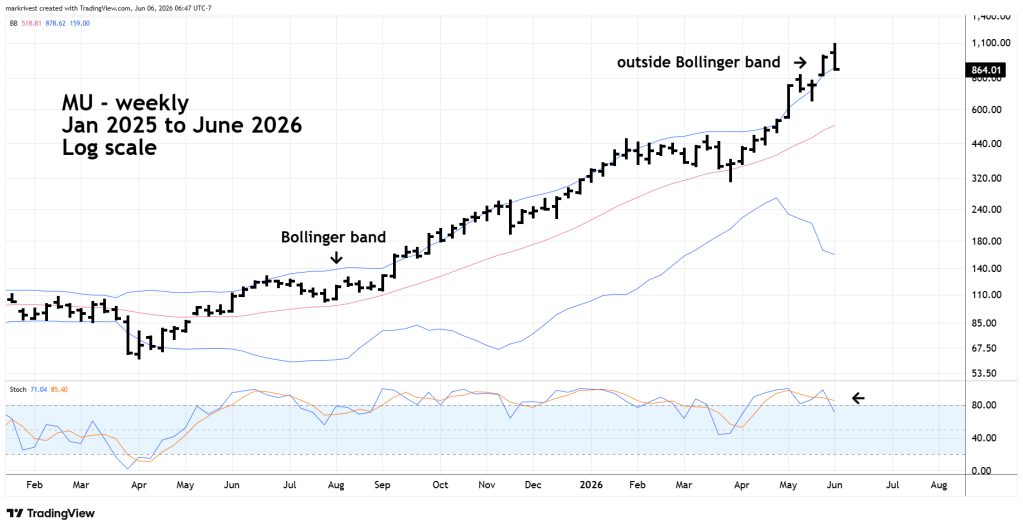
The 05/28/26 blog “Massive Rally of Micron Technology Inc.” illustrated its weekly price bar was outside the upper Bollinger band.
A weekly price bar going and staying below its upper Bollinger band could be a very bearish signal.
The MU – March to June 2026 rally may have been a blowoff top. MU could have a multi-week crash to 300!
