On 05/29/26 all three main U.S. stock indices; S&P 500, Dow Jones Industrial Average, and Nasdaq Composite made new all-time highs. Most major U.S. stock market peaks occur with only one of the three main U.S. stock indices making a new all-time high. Elliott wave analysis reveals where one of the three main indices could make an important top.
The 30 – minute S&P 500 (SPX) chart courtesy of Trading View illustrates the intraday action.
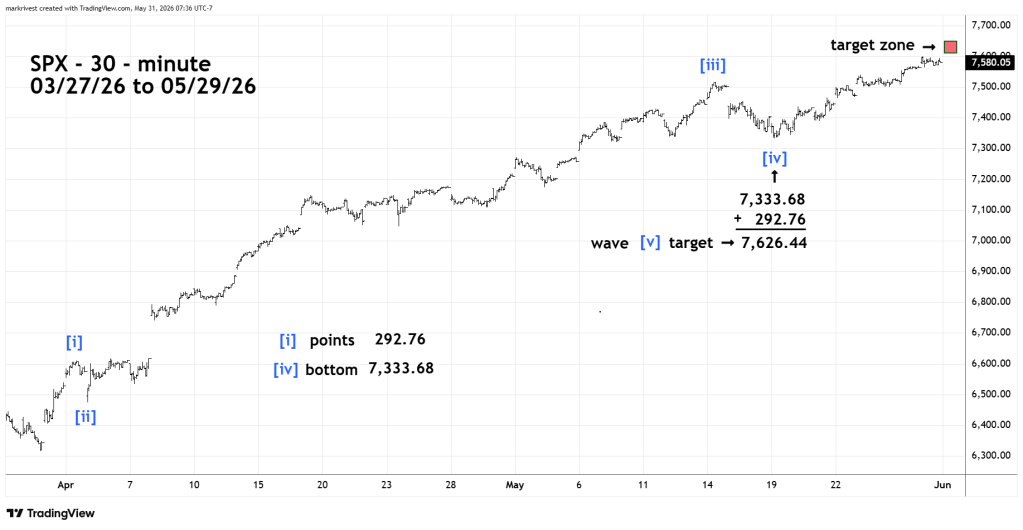
This is an update to the 30 – minute SPX chart shown in the 05/21/26 blog “Rising to a New All – Time High? – 05/21/26”
There’s usually Fibonacci relationships between Elliott wave segments.
Within motive waves sometimes the first wave will equal the length of the fifth wave. In this case the presumed wave [ i ] is 292.76 points. Added to the presumed wave [ iv ] bottom of 7,333.68 targets 7,626.44 as the termination point for wave [ v ].
The broad topping zone is approximately 7,610 to 7,650.
Sometimes markets or stocks can turn on New/Full Moons plus or minus two trading days. There’s a Full Moon on 05/31/26. Assuming the SPX did not peak on 05/29/26, a major high could be made on 06/01/26 or 06/02/26.

