The relentless selling of U.S. stocks on 11/05/26 is probably the start of a multi-week decline.
This website’s previous blog post suggested that the S&P 500 (SPX) may have been in an upward post-triangle thrust following an Elliott wave Horizontal Triangle. The invalidation level for the Horizontal Triangle was the 10/30/26 bottom at 7,527.55. Not only was this low quickly broken, but also the 09/16/26 bottom at 7,507.77.
The weekly SPX chart courtesy of Trading View illustrates the long-term view.
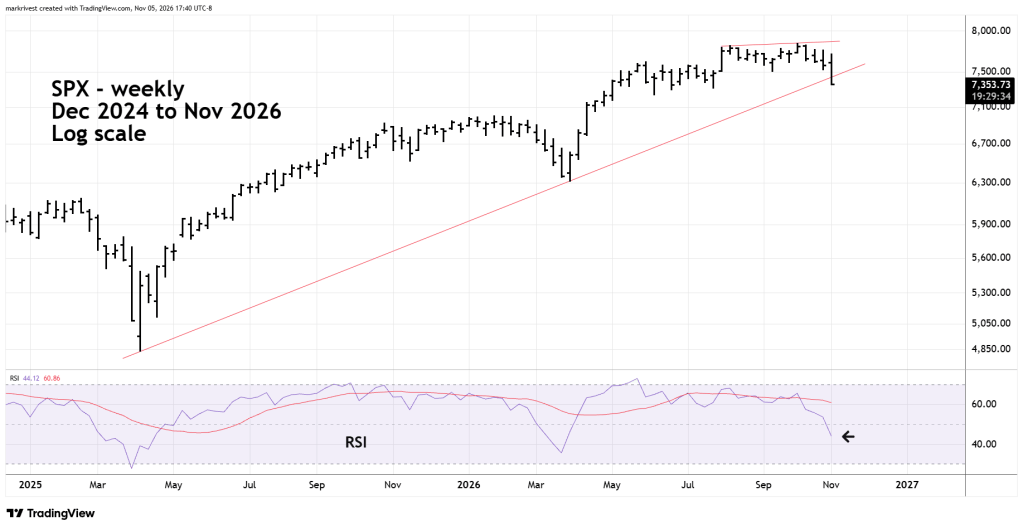
The rising trendline connecting the April 2025 bottom and the March 2026 bottom was broken. The weekly RSI is at 44.12 far above the oversold level which begins at 30.00.
The trendline breakthrough and weekly RSI reading strongly implies several more weeks of downside action. SPX could reach the March 2026 bottom before the end of 2026.
The weekly VIX – volatility index chart shows its long-term breakthrough.
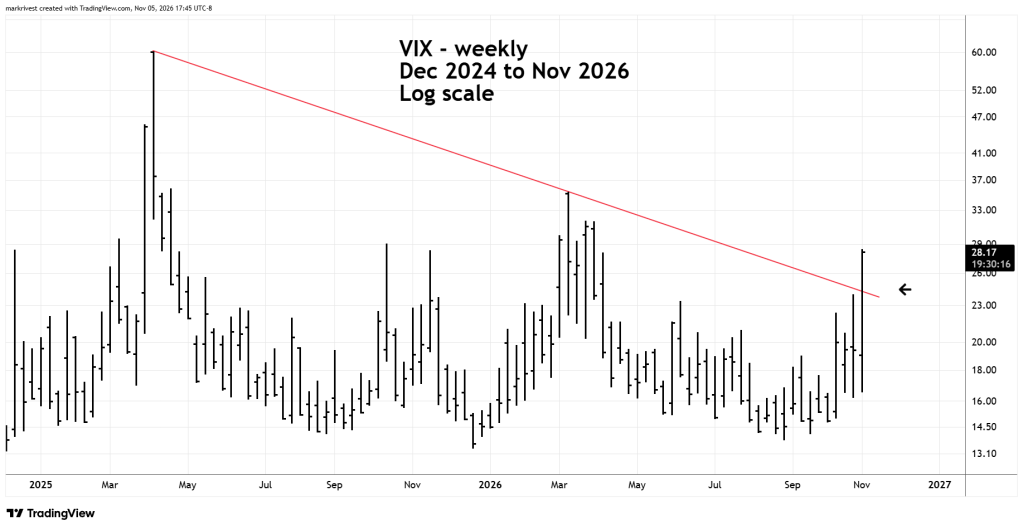
The VIX breakthrough matches the SPX breakthrough. There’s a high probability U.S. stock could continue declining

