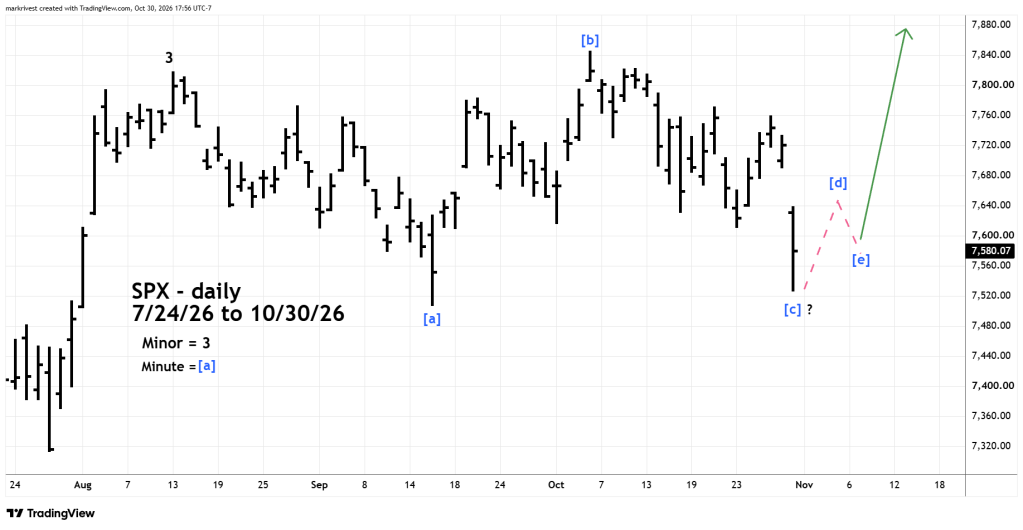
The 10/30/26 blog “Elliott Wave Update – 10/30/26” speculated that the S&P 500 (SPX) from early August may have been forming an Elliott wave – Horizontal Triangle.
The SPX daily chart from that blog is illustrated below.
The one – hour SPX chart courtesy of Trading View shows what happened.
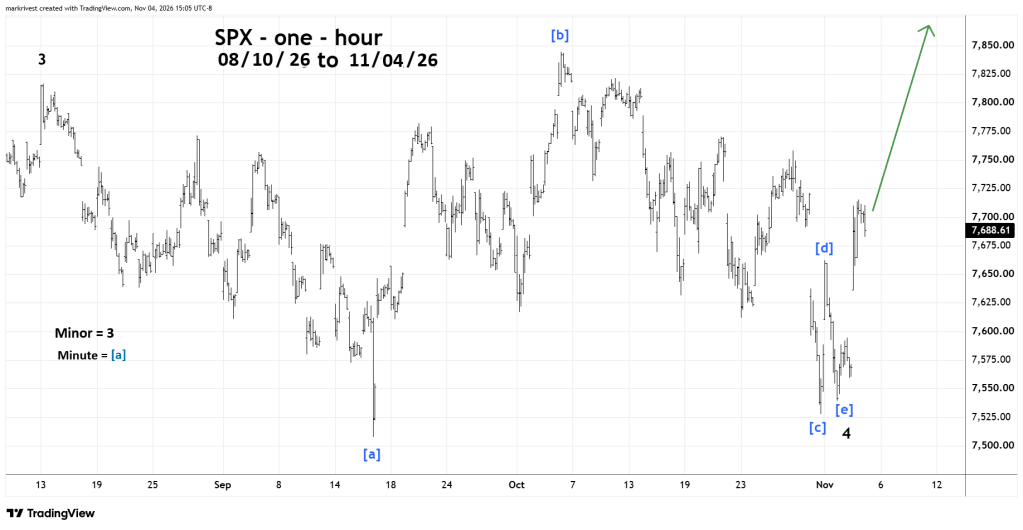
The bottom made on 10/30/26 labeled Minute wave [ c ] at 7,527.55 is important support. A break below that level will invalidate the wave count.
The presumed Horizonal Triangle is probably complete on 11/03/26. The post triangle trust up could only last a few trading days.
Sometimes markets can turn on New/Full Moons plus or minus two trading days.
There’s a New Moon on 11/09/26.

