In the 08/30/26 blog “Are Oil Bulls Out of Time?” it appeared that Crude Oil may have completed or was close to completion of an Elliott wave – Inverse Horizontal Triangle. The blog noted that a move above the 08/21/26 peak at 85.46 was bullish. This movement did happen and invalidated the presumed Inverse Horizontal Triangle.
Crude Oil still has the potential for a multi-month decline based on two factors. Seasonal trends for Crude Oil are bearish from September to December, and possible Fibonacci resistance.
First a review of seasonal trends. Below is a reprint of the Crude Oil season trends chart courtesy of EquityClock.com which was illustrated in the 08/30/26 blog.
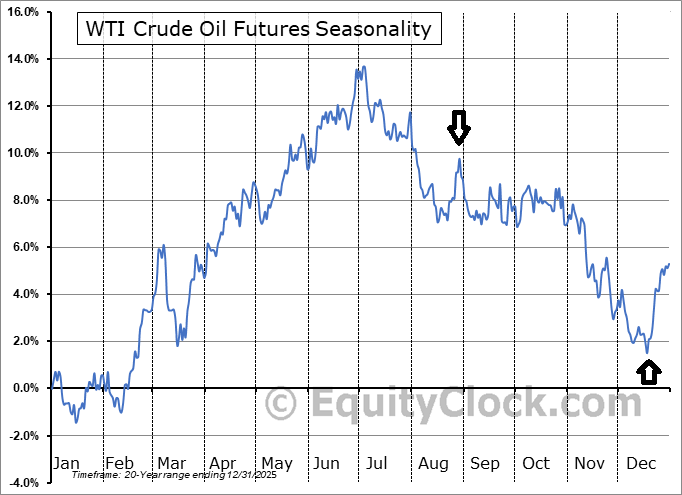
Note that Crude Oil is now beyond the seasonal spike up from mid to late August and is now vulnerable to a sharp move down. If this occurs it could be the start of a decline until December 2026.
To determine why Crude Oil could currently be trading around potential resistance we need to examine what happened at Crude Oils peak in March 2026.
The 30 – minute Crude Oil continuous futures chart – Trading View symbol (CL2!) is illustrated below.
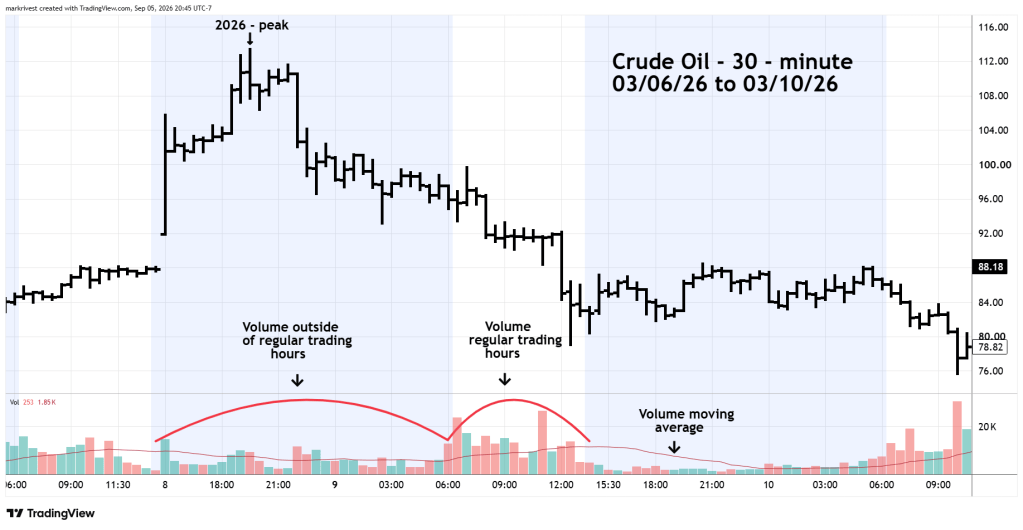
Please note the hourly increments on this chart are Pacific Standard Time.
Fibonacci analysis measures movements of the “mass mind” the best results are derived from examination of heavily traded markets and what time these markets are trading.
The Crude Oil 2026 peak occurred on Sunday March 8th outside of regular session hours. Note the decrease in trading volume outside of regular session hours. The volume moving average effectively illustrates this phenomenon.
What may have occurred on Sunday March 8th was that a few Crude Oil funds were improperly hedged and got caught in a short squeeze. After these traders were forced to buy out of their short positions price collapsed. A minority of traders do not represent the “mass mind”.
Also Sunday is not a regular trading day. Please note the Fibonacci analysis of the S&P 500 on this website always examines the cash market which trades from Monday through Friday. S&P 500 – futures trade on Sunday and that action is never used for Fibonacci analysis because of the low trading volume.
The daily Crude Oil chart illustrates Fibonacci analysis factoring out the action of Sunday March 8th.
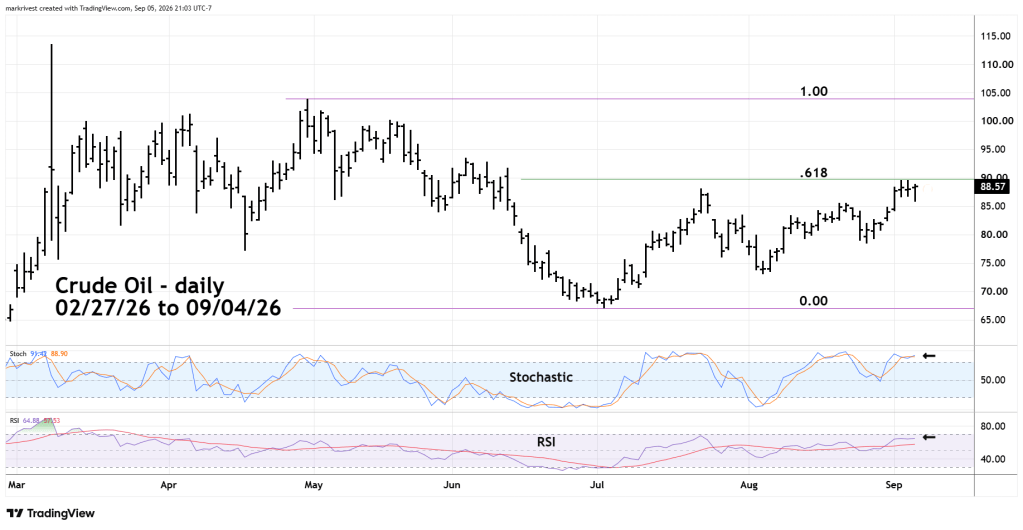
A Fibonacci .618 retrace of the March to July decline is near 95.00. A Fibonacci .618 retracement from the peak made on Thursday April 30th to Thursday July 2nd is close to 90.00. On 09/02/26 Crude Oil reached 89.51.
In the short – term daily RSI is below the overbought zone that begins at 70.00. This implies potential for more upside action. Stochastics is in its overbought zone and has flattened out, this condition could continue for several days.
Crude Oils bull market potential could be measured in days. If resistance occurs somewhere near 90.00 the next decline could be measured in weeks.

