Recently many U.S. stocks have been in a sideways channel. A trend line break could provide an important signal.
The daily charts of S&P 500 (SPX), Financial sector – ETF (XLF), and Technology sector – ETF (XLK) examines their relationship.
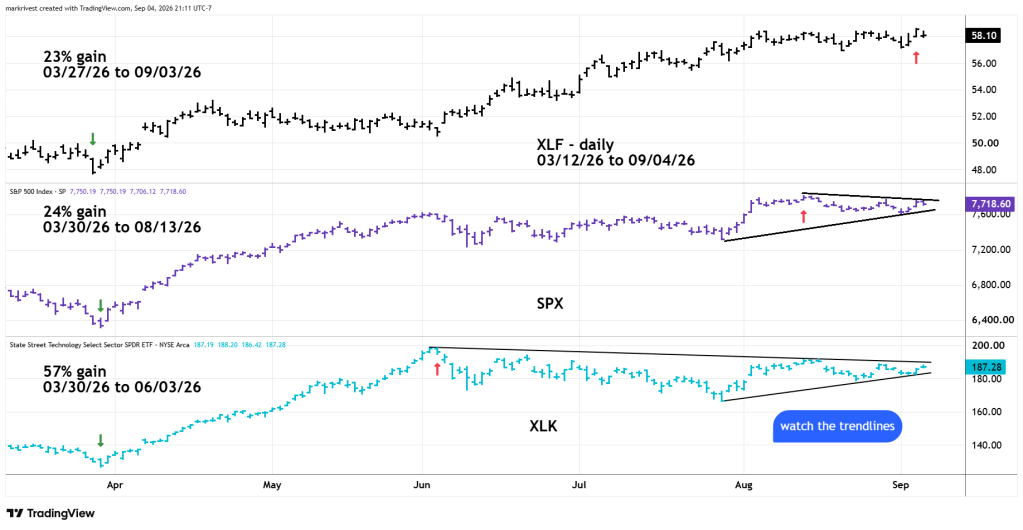
After the late March to June- XLK led the U.S. stock market with an amazing 57% gain. After June XLF was the leader. This index since March has a gain of 23%. On 09/03/26 it reached a new all-time high. This new high was only confirmed by the Energy sector – ETF (XLE). The Dow Industrial Average, Nasdaq Composite, Russell 2000, and SPX all failed to make new – all-time highs.
Since June, SPX and XLK may have been forming bases before reaching new all-time highs. From an Elliott Wave perspective, both indexes may be forming—or may have completed—Horizontal Triangles.
Moves above the upper trend lines could be the start of a multi-week rally.
Moves below the lower trend lines could be the start of a multi-week decline.
U.S. stock market seasonals could be the most important factor. September and October are typically bearish.
Also, the action on 09/04/26 was bearish. At 8:30 AM – EDT an hour before the regular stock session began the monthly U.S. employment report was released.
U.S. Nonfarm Payrolls surged past expectations, indicating economic strength. This should have triggered a sharp stock market rally. Yet – S&P 500 – futures fell on the news. The downtrend continued into the regular session before a bottom was made at 11:30 AM – EDT.
On 09/08/26 a move below SPX 09/04/26 low of the day could be an important bearish signal. If so, watch the SPX rising trend line from its late July 2026 bottom.

