Recently views of this website in the Peoples Republic of China have greatly increased. Welcome! Today’s blog focuses on the long – term Elliott wave count for the Shanghai Composite index and what may develop in the next few years.
The monthly chart for the Shanghai Stock Exchange Composite Index – SSE – Trading View symbol (000001) illustrates the long – term picture.
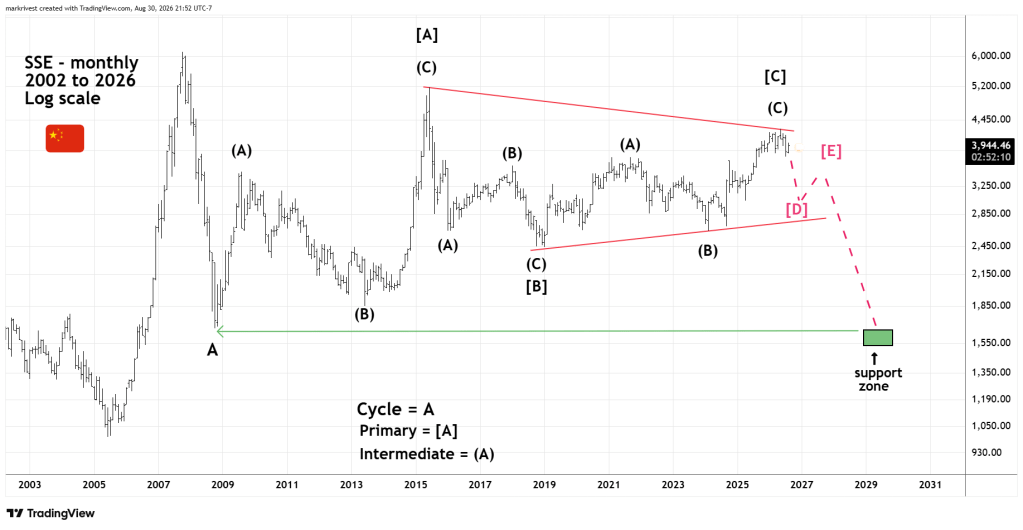
The SSE was illustrated in the 06/22/24 blog “Long-Term Analysis of Asian Stock Markets”. At the time it appeared that a multi-year Elliott wave – Inverse Horizontal Triangle had ended. As it turned out, the presumed Horizontal Triangle was and probably is still developing.
Horizontal Triangles are net sideways corrections of the main trend, which in this case is down.
The 2007 to 2008 large sharp decline labeled Cycle wave “A” is a clear Elliott Impulse wave. The Inverse Horizontal Triangle begins at the November 2008 bottom.
Horizontal Triangle are composed of five – sub waves each of which further subdivide into three waves or a combination of three waves. Primary waves [A] and [B] are very clear Single Zigzags. For the sake of clarity Primary Wave [C] is illustrated as a Single Zigzag, this more complex structure is a Double Zigzag.
The decline since June 2026 is the presumed developing Primary wave [D]. This phase down could be part of a global bear market.
Waves “D” and “E” are typically much smaller in proportion to the prior three waves. It’s possible the final two waves could be completed within the next two years.
The completed Inverse Horizontal Triangle from November 2008 would be Cycle wave “B”. The post triangle decline would be Cycle wave “C”.
If a major bottom is made in 2029 it would be a Fibonacci 21 – years since the prior major bottom in 2008.

