Momentum and Elliott wave structure imply Crude Oil could reach 95.00 in early September 2026.
The daily continuous Crude Oil futures (CL2!) chart courtesy of Trading View illustrates its action.
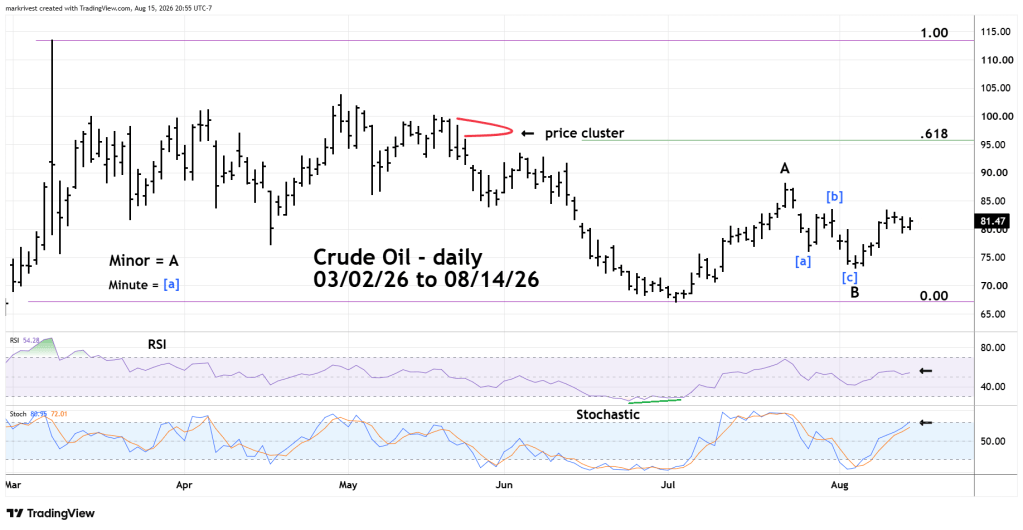
From an Elliott wave perspective, the important area to focus on is what happened after the 07/02/26 bottom at 67.12.
Please note that after the 07/02/26 to 07/23/26 rally labeled Minor wave “A” the subsequent decline was a very clear Elliott wave – Single Zigzag. This implies the decline is only a correction of the 07/02/26 to 07/23/26 rally, and in the very short-term price could rise at least to the 07/23/26 peak.
Momentum indicators support this theory.
Daily RSI is in the neutral zone well below the overbought zone which begins at 70.00.
The upper line of Stochastic has reached the edge of the overbought zone at 80.00. However, note that in the Minor wave “A” rally Stochastic went deep into the overbought zone then flattened.
A move above 83.44 labeled Minute wave [b] opens the door for a rally back to the Minor wave “A” peak at 88.07. A move above 88.07 could trigger a rise to the 95.00 area. The Fibonacci .618 retrace of the 113.41 to 67.12 decline is at 95.27.
Note there’s a price cluster just above the Fibonacci level, this is where the bears could launch a counterattack.
If the bulls can blast through the 04/30/26 high at 103.78 it could trigger a move to the 2026 high at 113.41.
Broad resistance area is from 95.00 to 100.00.
If within the next two weeks price moves below 67.12 it would invalidate the bullish Elliott wave count.

