On 08/14/26 none of the three main U.S. stock indices; S&P 500, Dow Jones Industrial Average, or Nasdaq Composite made new all-time highs. However, the small cap index – Russell 2000 (RUT) made a new all-time high. Is this this a sign of more upside action or the bulls last gasp?
The daily RUT chart courtesy of Trading View shows what’s happened since mid-April 2026.
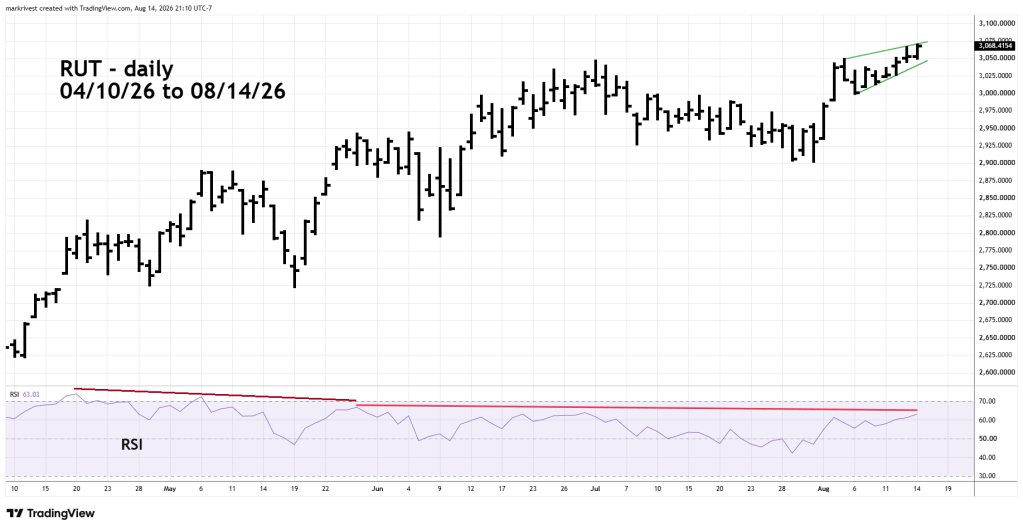
Since 04/20/26 momentum as measured by RSI has diminished while price rises.
Also please note the potentially bearish wedge that’s formed since 08/05/26.
The five – minute RUT chart illustrates a fascinating Elliott wave pattern.
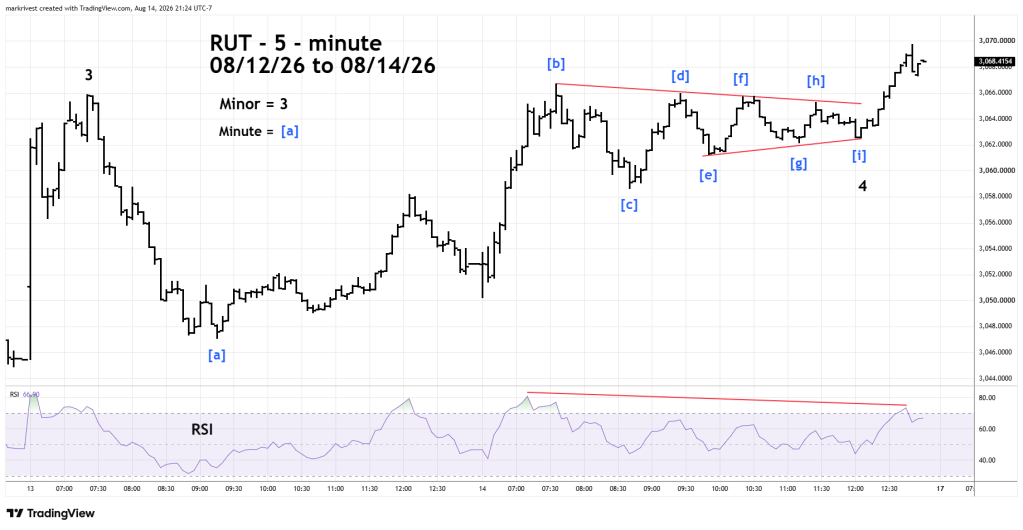
The movement from 08/13/26 to 08/14/26 is a rare Elliott – nine wave Horizontal Triangle. This is like an Elliott five – wave Impulse extending into a nine – wave pattern. The rally in the last trading hour of 08/14/26 appears to be a post triangle thrust.
On 08/17/26 watch if any of the three main U.S. stock indices or the RUT make new all-time highs. If all four of these indices fail to make new all-time highs, it could be the start of a multi-week decline.

