Since the S&P 500 (SPX) reached a solo all-time high on 08/13/26, U.S. stocks have gradually and quietly declined. This could be the start of a much larger drop.
The daily SPX chart courtesy of StockCharts.com illustrates external momentum.
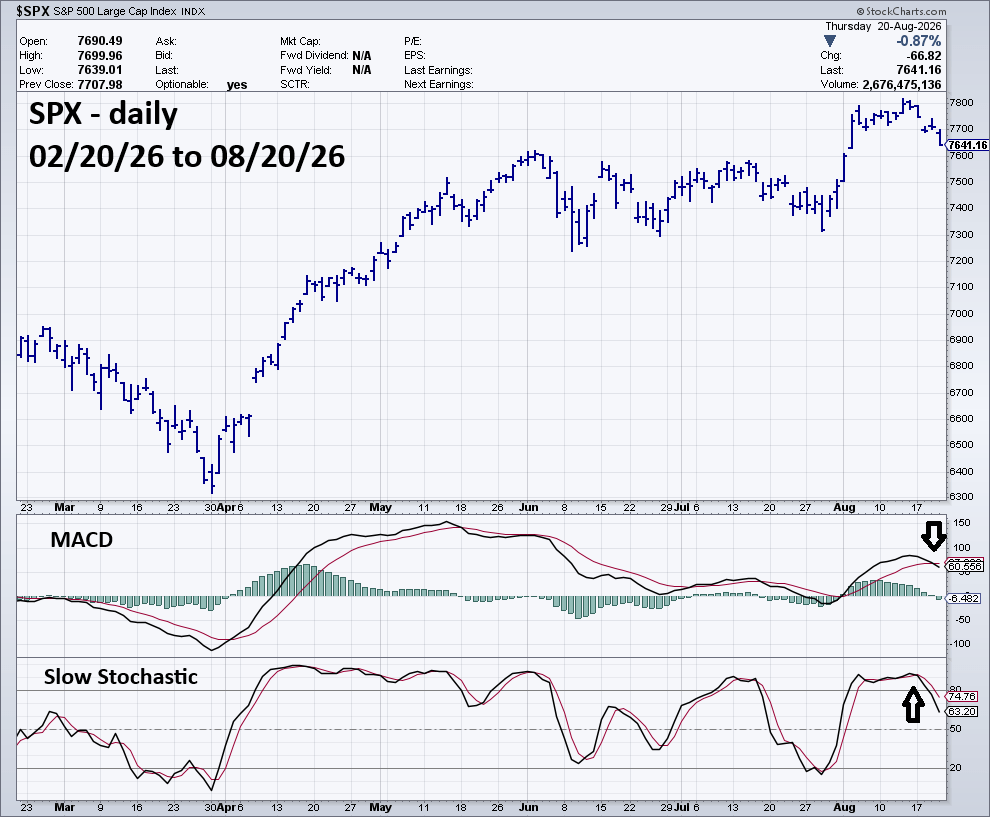
Daily Slow Stochastic had a bearish line cross in the overbought zone and has now crossed into the neutral zone below 80.00.
The slower moving MACD had a bearish line cross on 08/20/26.
The one – hour SPX chart courtesy of Trading View shows the intraday action.
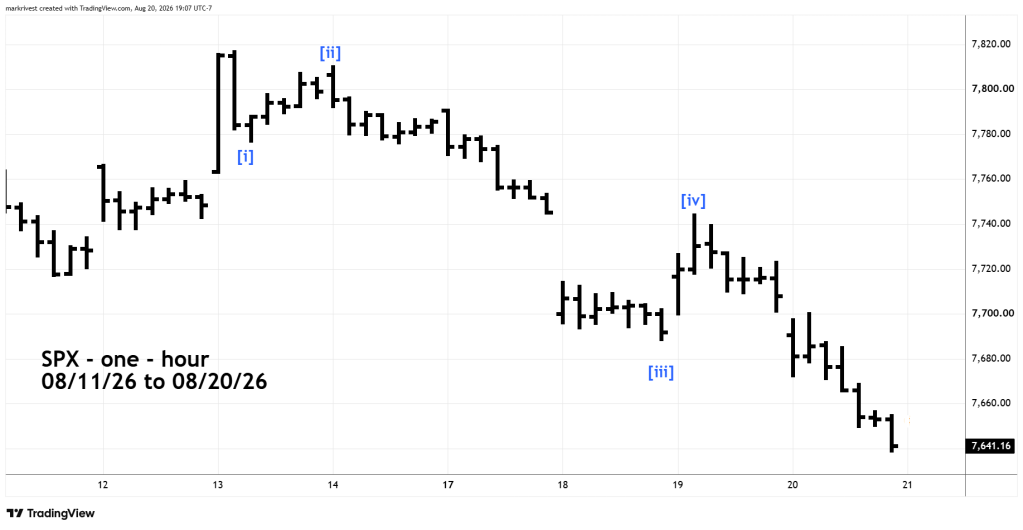
SPX is declining in a clear Elliott – Impulse pattern. If so, this could be the first wave down of a larger developing five wave pattern.
There’s a high probability for more SPX downside action during the week of 08/24/26 to 08/28/26.

