The prior blog “Prelude to New Highs? – July 2026” illustrated that the S&P 500 (SPX) since 06/02/26 may have formed an Elliott wave – Horizontal Triangle. As of 07/09/26 SPX was at the edge of a declining trendline from the 06/15/26 peak. The break above this trendline on 07/10/26 should have triggered a powerful thrust up. What happened was a plodding rally diminishing the chances for a new SPX all-time high.
The daily S&P 500 chart – StockCharts.com symbol ($SPX) illustrates recent momentum.
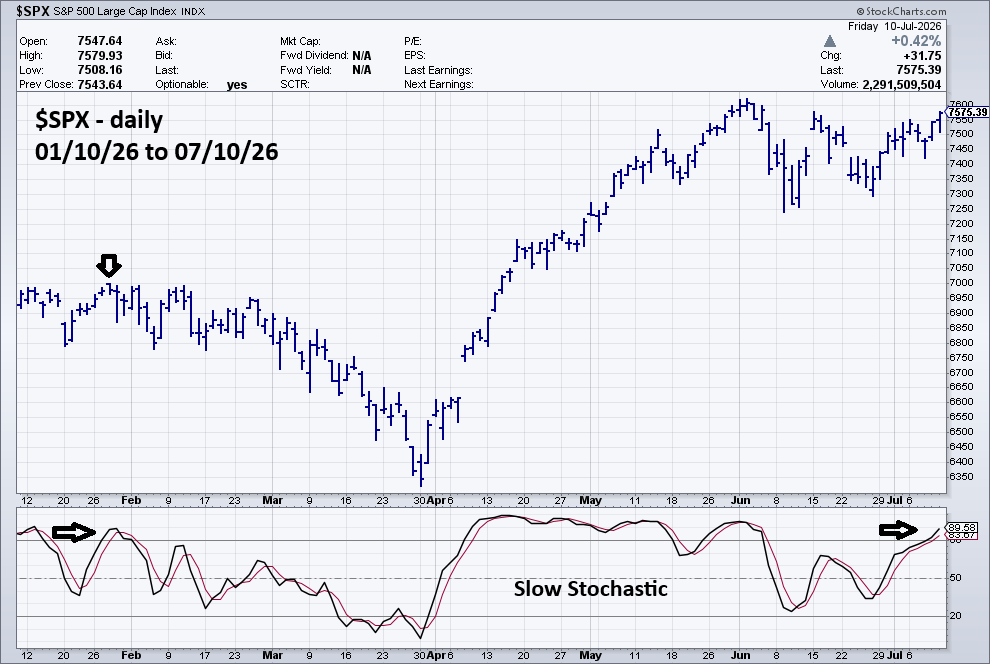
Both Slow Stochastic lines have entered the overbought zone above 80.00, matching the level reached at the late-January 2026 $SPX peak. Could the Slow Stochastic move higher? Yes, however, a level has been reached where an important secondary $SPX peak could be formed.
There are always alternate Elliott wave counts. The 3 – hour S&P 500 chart – Trading View symbol (SPX) shows what could be happening.

Please note that the 06/19/26 blog “The First Tracks of a Looming Bear Market?” illustrated the early June decline as an Elliott – impulse wave. This is still a valid wave count which pertains to the strength of the next potential decline. For now, the important factor is – could the SPX be forming a secondary peak.
The rally after the 06/09/26 bottom is illustrated as an Elliott wave – Double Zigzag. In a broader sense this is a three – wave or three phase correction. If the main trend is down, ideally the second wave/phase up should be higher than the first wave/phase.
In this case the SPX 07/10/26 peak was 7,579.93 marginally above the 06/15/26 peak of 7,577.92.
If this wave count is correct, SPX likely opens the 07/13/26 session down from the prior trading day close. If that occurs SPX could go down the entire day.
 Four Dimension Trading