The S&P 500 (SPX) could be close to making new all-time highs.
Since the 06/02/26 peak SPX has meander sideways. The 3 – hour SPX chart courtesy of Trading View illustrates the most likely Elliott wave count.
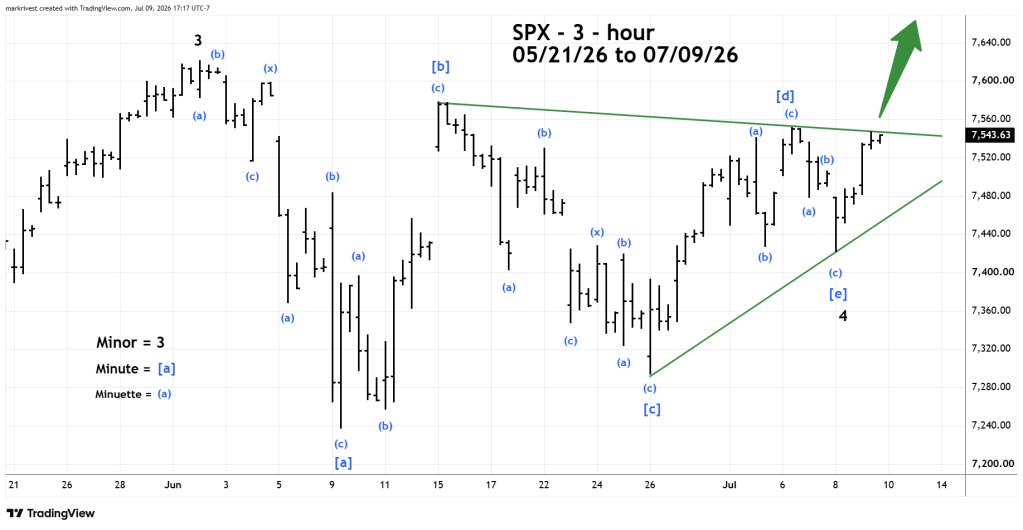
SPX since its all-time high on 06/02/26 appears to have formed an Elliott wave – Horizontal Triangle. These are net sideways corrections of the main trend that only appear in the fourth wave position of motive patterns and in “B” wave position of corrective patterns. They are composed of five sub waves each of which further subdivide into three waves or a combination of three waves.
A move above the declining trendline from the 06/15/26 peak could be an important bullish signal. A breakthrough could trigger a rally to the 7,700 area.

