As we enter mid – July 2026 two U.S. stock market momentum indicators are giving conflicting messages.
First a look at the Advance/Decline (A/D) line which has a long history of forecasting significant U.S. stock market turns. The A/D line peaks prior to stock index ultimate peaks, creating a bearish divergence. At significant bottoms the A/D line lows are made prior to stock index bottoms.
The daily NYSE A/D line($NYAD) chart courtesy of StockCharts.com illustrates its action.

This chart was last shown in the 06/27/26 blog “Advance/Decline Lines at New Highs – June 2026”.
On 07/06/26 the NYSE – A/D line made its all-time high. On 07/07/26 the NYSE Composite index – StockCharts.com symbol ($NYA) made its all-time high. A minor bearish divergence. Normally the divergences occur weeks apart. The so far tiny divergence implies $NYA could continue to rise.
The next daily A/D line chart ($SPXADP) is for the S&P 500 ($SPX).

This chart was also illustrated in the 06/27/26 blog.
On 06/02/26 $SPX reached its all-time high. Please note that the A/D line peaked in April. This is the normal type of bearish divergence witnessed at significant stock index peaks. Since 06/02/26 $SPX has failed to make a new high while the A/D line climbed and has made new highs.
This could be viewed as a bullish signal for $SPX, however, it must be viewed in a broader context.
The next daily chart courtesy of Barchart.com shows the NYSE – 52 – week highs.
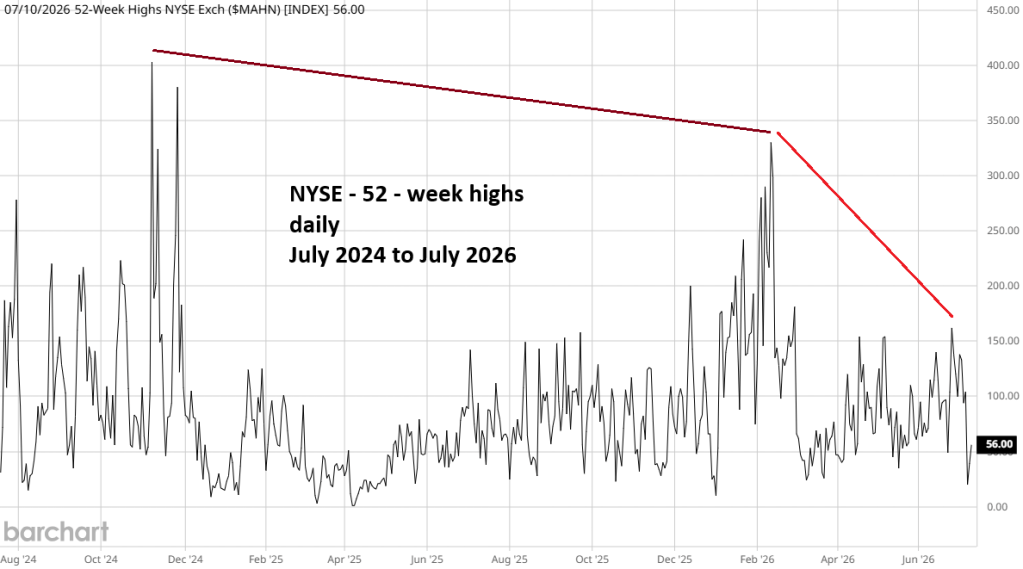
Not only are there two massive bearish divergences since late 2024, new highs since 07/01/26 have fallen off a cliff! This recent collapse has occurred while the NYSE Composite has had a modest rally!
Now let’s look at the Nasdaq Composite.

The same long-term and near-term collapse of new highs.
A case could be made that the low level of 52 – week highs mean the U.S. stock market is internally oversold and the stock indices could continue to rally.
The normal situation for a stock bull market has price indices confirmed by the A/D line and new 52 – week highs.
For the U.S. stock market in July 2026 either the A/D line is giving a false signal, or the 52 – week highs are giving phony indications.
We may know soon. Monday July 13, 2026, could be a very important day.

