At 8:30AM -EDT on 05/08/26 an hour before the start of the S&P 500 (SPX) session, the monthly U.S. Employment report was released. S&P 500 futures rallied to new all-time highs. The rally lasted only five- minutes, followed by a decline that erased the entire rally.
This is very unusual, normally S&P futures rallies after the 8:30 AM reports hold their gains. Subsequently S&P futures resumed the move up, however the rapid reversal after the 8:30 AM report was a sign an SPX rally on 05/08/26 could be weak.
The one – hour SPX chart courtesy of Trading View shows what happened during the 05/08/26 trading session.
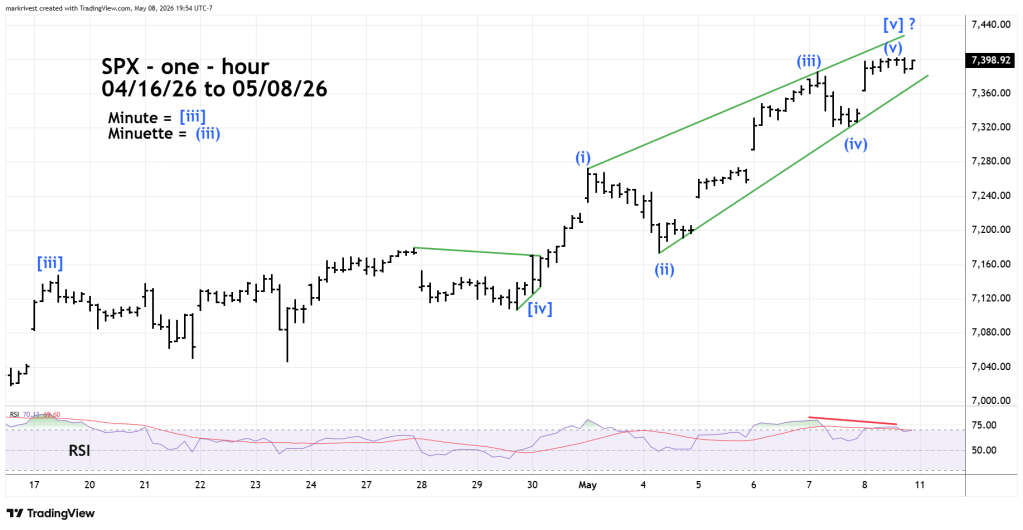
SPX made an all-time in the first hour then stayed in a narrow range. Houry RSI had a bearish divergence, and the presumed Elliott Impulse wave from the 03/30/26 bottom could be complete. The SPX high on 05/08/26 was 7,401 just below potential Fibonacci resistance of 7,426 illustrated in this website prior blog.
The next chart courtesy of Barcart.com illustrates NYSE – 52 -week highs ($MAHN).
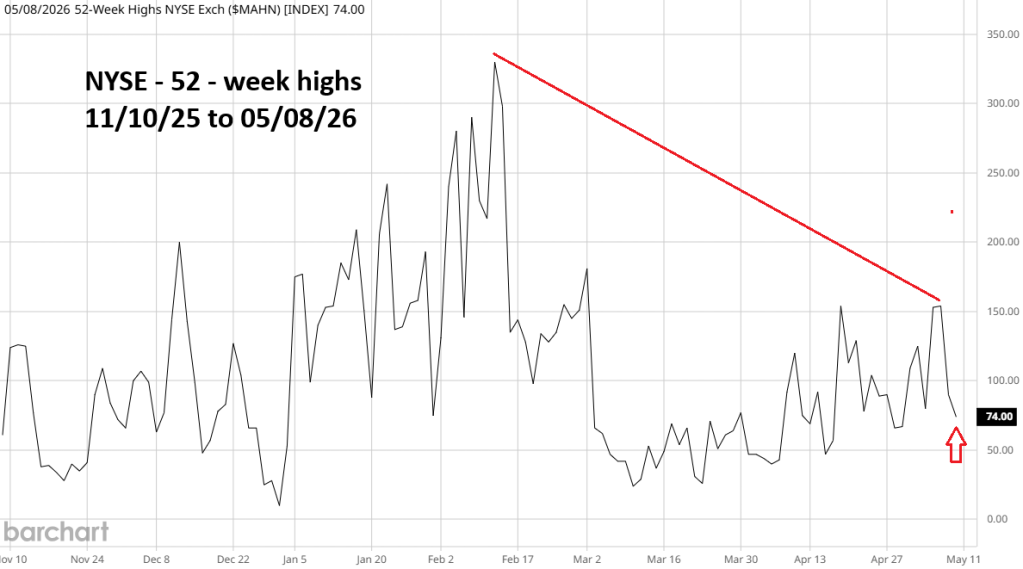
$MAHN continues to have a significant bearish divergence vs. the reading made in mid – February. Shockingly, 52-week highs declined on 05/08/26.
The next Barchart.com chart shows NYSE – 52 – week lows.
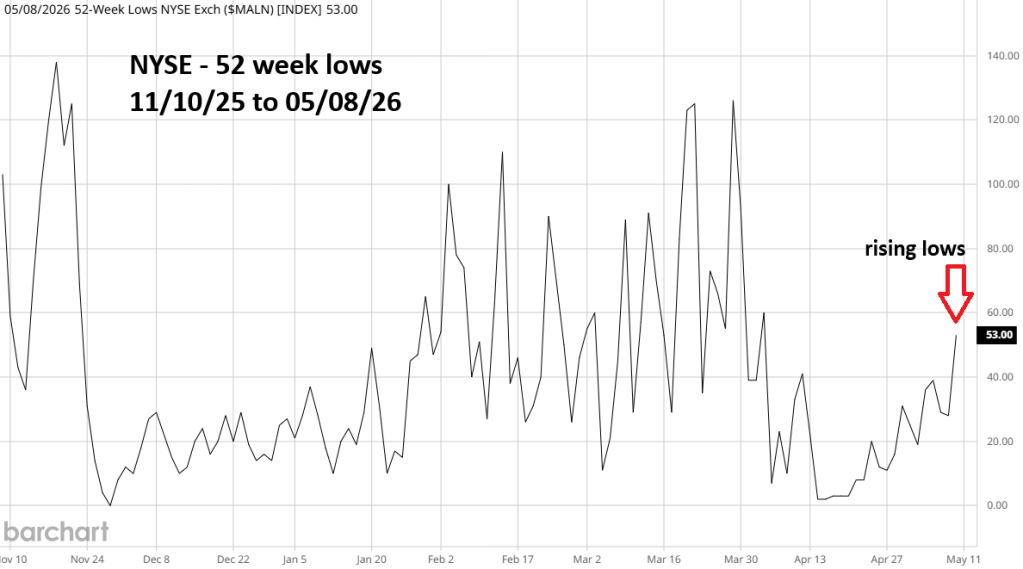
From 04/13/26 to 05/08/26 – SPX rose 9%. During that same time NYSE 52 – week lows have been moving up!
SPX – Elliott wave patterns, potential Fibonacci resistance, and bearish internal momentum strongly suggest U.S. stocks could be forming an important peak.
On 05/11/26 watch the Nasdaq Composite. If this index makes an all-time high unconfirmed by the SPX and Dow Jones Industrial Average, it could be the ultimate bearish signal.
 Four Dimension Trading
If you take a look at the NYSE Composite index, it hit a high on Feb 26. Despite this, the cumulative NYSE A/D line has been making new highs since mid-April. The most recent cumulative A/D line high was made on May 6. This represents a bullish divergence between the NYSE index and the cumulative A/D line.
LikeLike
Correct this is a bullish factor. The NYSE cumulative A/D peaked 02/27/26 two weeks after the NYSE top and four weeks after the SPX top. This signal went against the price down trend.
At important stock market tops there usually at least one bullish factor that’s causes doubt as to market direction.
For now the weight of momentum evidence from the SPX A/D line new highs and lows is bearish.
We could find out soon if the NYSE A/D line is signaling more rally or a fake out.
Mark
LikeLike