A follower to this website made a very interesting comment regarding the NYSE – A/D line, stating that the NYSE Composite (NYA) peaked in February and the NYSE – A/D line made a new high on 05/06/26. This is a bullish divergence that requires further examination.
The daily NYA and S&P 500 (SPX) chart courtesy of Trading View gives us a starting point for perspective.
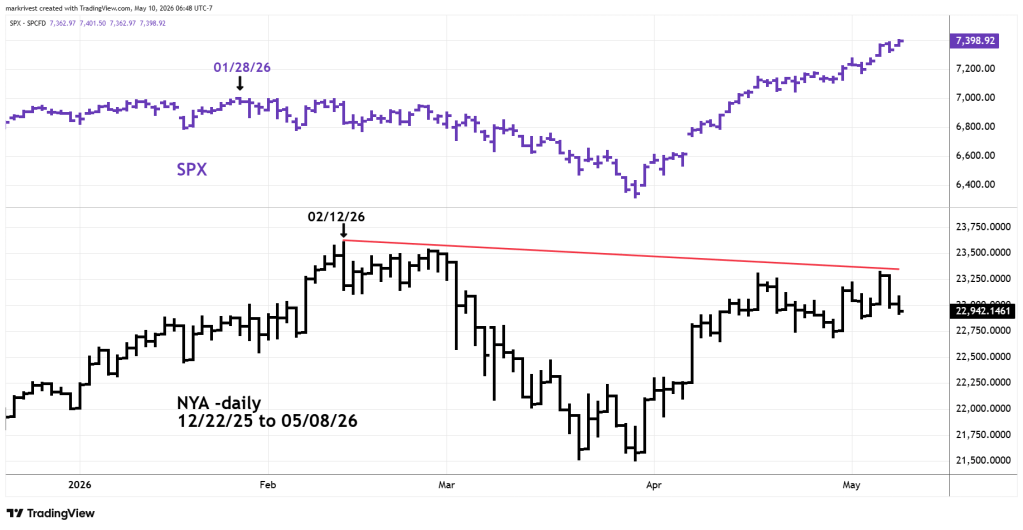
The NYA in February 2026 was bullishly outperforming SPX. In May- NYA has a bearish divergence.
Now let’s look at the daily NYSE – A/D line ($NYAD) courtesy of StockCharts.com.
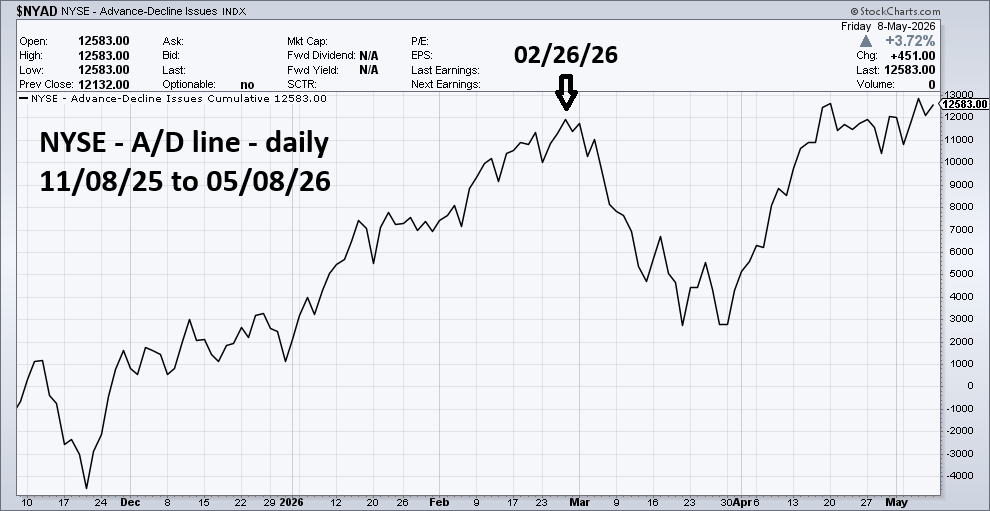
$NYAD has a bullish divergence vs. NYA and is above its late February 2026 high.
The S&P 500 – A/D line ($SPXADP) has a different look.
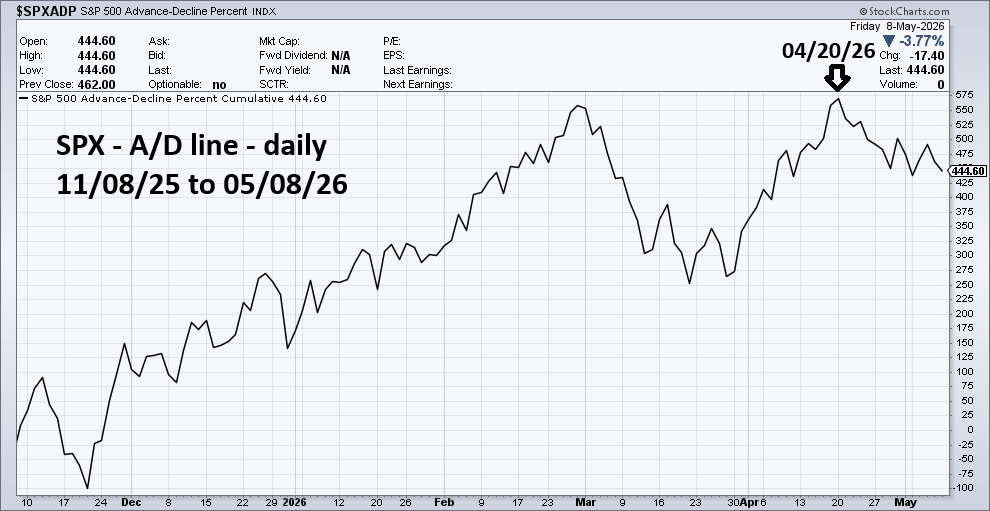
$SPXADP peaked on 04/20/26. The SPX since 04/20/26 has risen 4% while the $SPXADP line has declined!
One of these A/D lines is not telling the truth.
Examining the weight of evidence is the best way to determine if a market or a stock could have a trend change. The weight of evidence is never 100% there’s always at least one or two factors that cause doubt to a potential trend change.
For decades the NYSE – A/D line has been one of the most reliable indicators for the U.S. stock market. Peaking before a significant price top and bottoming before a significant price low.
Maybe this time the NYSE – A/D line is not reliable?
It’s already given a false bullish signal in late February 2026; it made a new high while the NYA and SPX were below their respective all-time highs. Subsequently prices declined in March.
We need to look at the weight of evidence. The data from NYSE – 52 – week highs and lows illustrated in this website prior blog strongly suggest a broad U.S. stock market decline could be imminent.
Evidence outside of the momentum dimension is also bearish.
We could have an answer soon.
