The powerful S&P 500 (SPX) rally since the 03/30/26 bottom is probably still developing. A Fibonacci inverse ratio forecasted the level of the SPX January 2026 peak, could also predict an SPX peak in May 2026.
The 12/27/25 blog “Rendezvous of Price and Time – December 2025” illustrated that the SPX – February to April 2025 decline multiplied by the Fibonacci inverse ratio of 1.618 forecasted a level where the SPX could make a significant top.
The daily SPX chart courtesy of Trading View shows what happened.
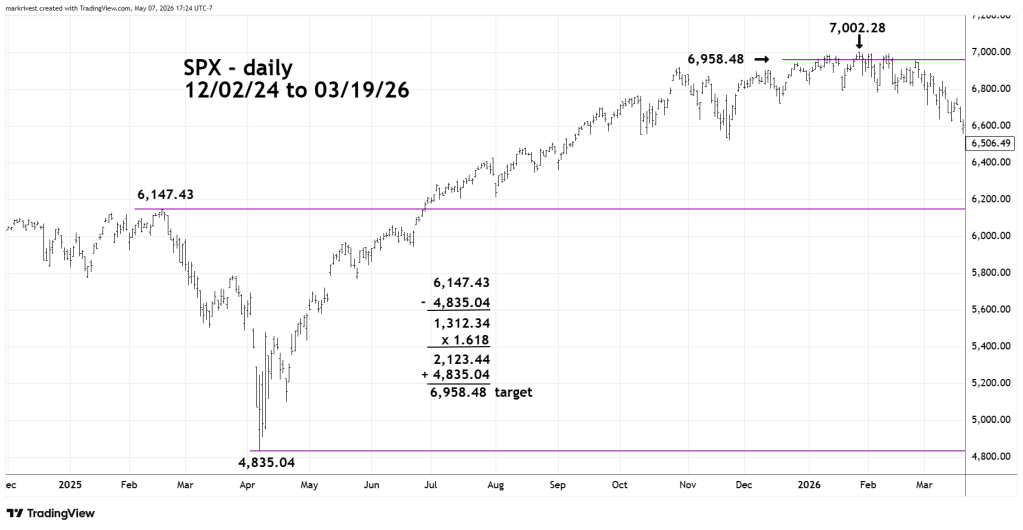
The forecasted peak was 6,958.48, the actual top was 7,002.28.
The next daily SPX chart illustrates what could happen in May 2026.
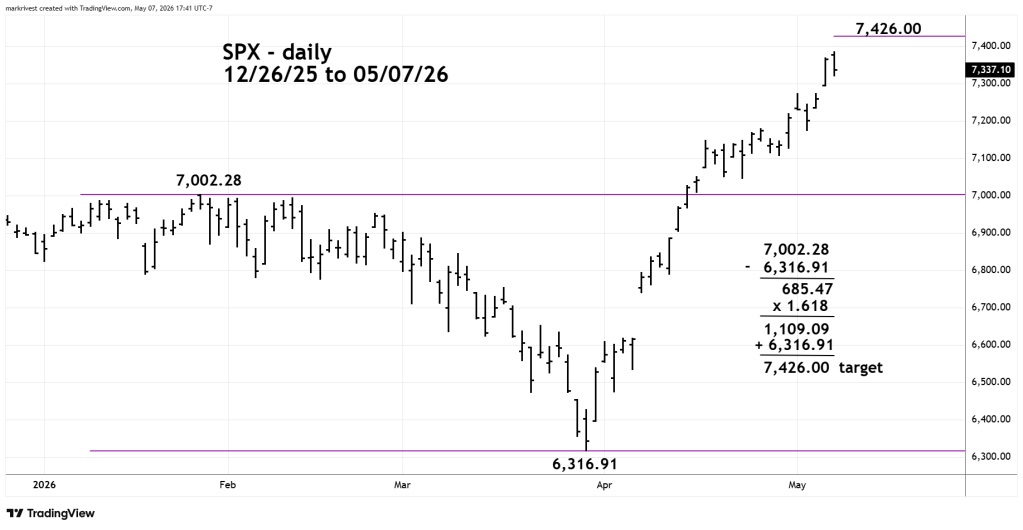
The SPX January to March 2026 decline multiplied by the Fibonacci inverse ratio of 1.618 targets SPX 7,426.00.
The one – hour SPX chart updates the short-term Elliott wave count.
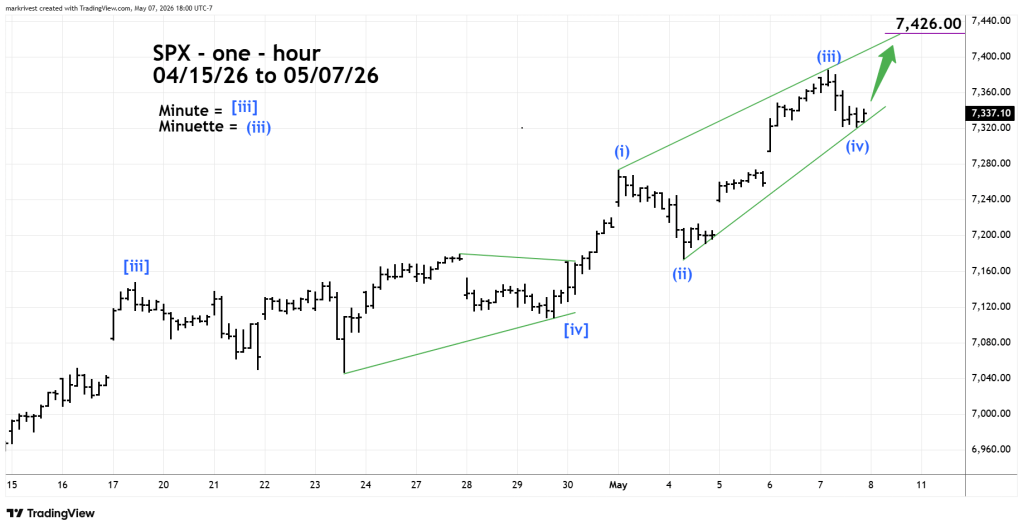
The rally from the presumed SPX – Horizontal Triangle termination point on 03/30/26 appears to be a developing Elliott – Impulse pattern.
If so, the Impulse wave could terminate on 05/08/26 or near SPX 7,426.00.
