The S&P 500 (SPX) and Nasdaq Composite (IXIC) rallies from 03/30/26 may have culminated in blowoff tops.
The daily SPX chart courtesy of Trading View shows the recent action.
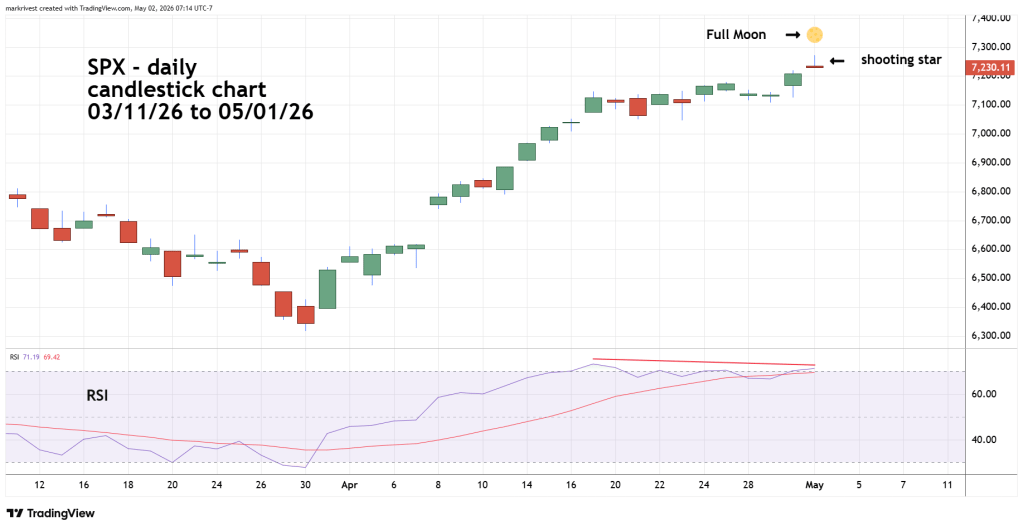
The candlestick chart illustrates a formation called a “Shooting Star” occurring on 05/01/26 which implies a bearish reversal. This happened on a Full Moon. Sometimes New or Full Moons can signal a market trend change plus or minus two trading days. Lunar signals are most likely to be effective during times of high emotions. Powerful nearly straight price moves up or down usually triggers high emotions. Please note the relentless move up since 03/30/26.
The potential peak was also on the first day of May. Sometimes markets can make turns on the cusp of a new month. Please note the bottom made on 03/30/26.
Daily RSI supports the theory of a 05/01/26 peak. Note the bearish momentum divergence vs. the peak made on 04/17/26.
The next daily chart courtesy of StockCharts.com illustrates the S&P 500 – Advance/Decline line ($SPXADP).
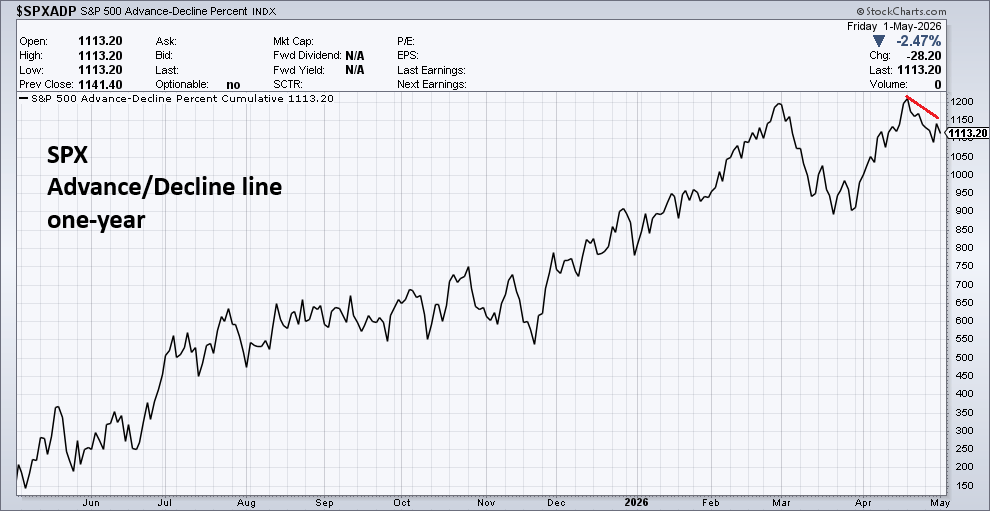
This internal momentum indicator confirms the bearish RSI signal.
The 15 – minute SPX chart updates the short-term Elliott wave count.
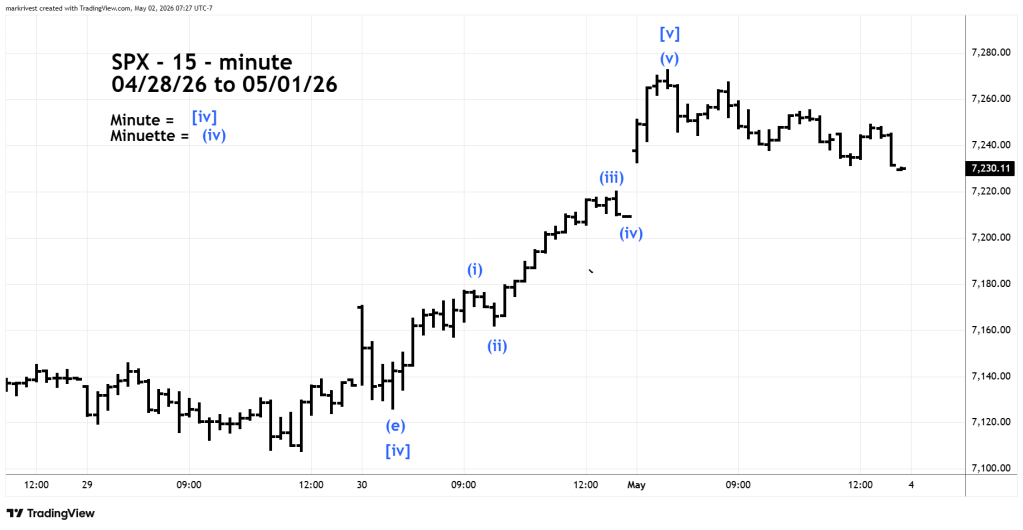
The prior blog on 04/30/26 illustrated the SPX – Elliott wave count from the 04/30/26 bottom was nearly complete. As of 05/01/26 the wave count is complete not only from the 04/30/26 bottom, but also from the 03/30/26 bottom.
The 04/25/26 blog “Short-Term S&P 500 – Elliott Wave Count – 04/24/26” noted that the broad upside target zone for an SPX peak is 7,230 to 7,330. The SPX high on 05/01/26 was 7,272.
The most likely scenario for 05/04/26 is SPX failing to move above the 05/01/26 high and to end the session below the 05/01/26 low.
