Long – term external and internal momentum indicators reveal fascinating aspects for the U.S. stock market.
The weekly S&P 500 (SPX) chart courtesy of Trading View illustrates external momentum.
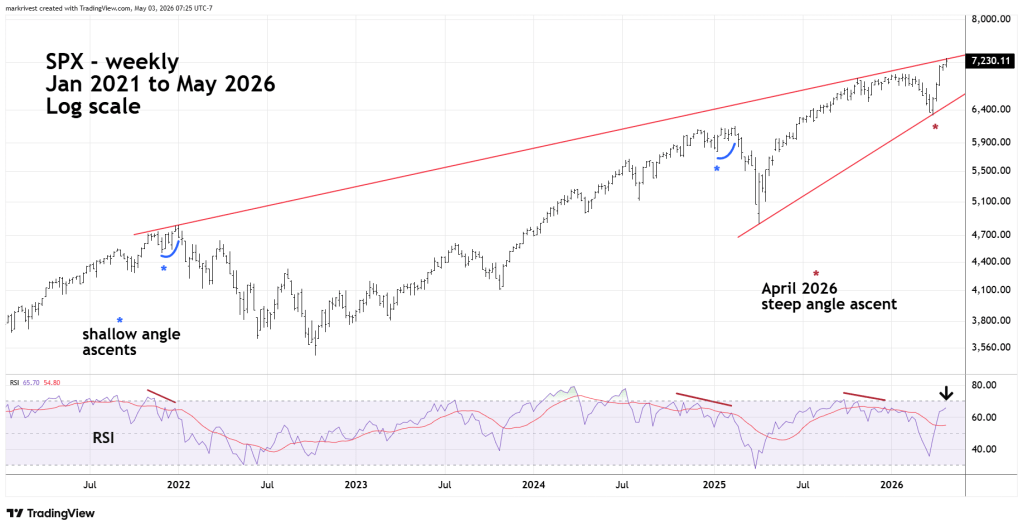
Note weekly RSI reading as of 05/01/26 has a bearish divergence vs. the readings made in late 2025. There is currently not a near – term weekly RSI bearish divergences such as what occurred in early 2025 and late 2021. The reason, a steep ascent from the 03/30/26 bottom.
Its possible the rally from 03/30/26 is the first wave up of a developing bull market that could continue into the balance of 2026. The weight of evidence for U.S stocks argue strongly against this bullish scenario. It’s more likely the rally since 03/30/26 is a blowoff top not a kickoff rally.
The daily NYSE – 52 – week highs chart ($MAHN) courtesy of Barchart.com is just one piece of evidence in favor of the bearish scenario.
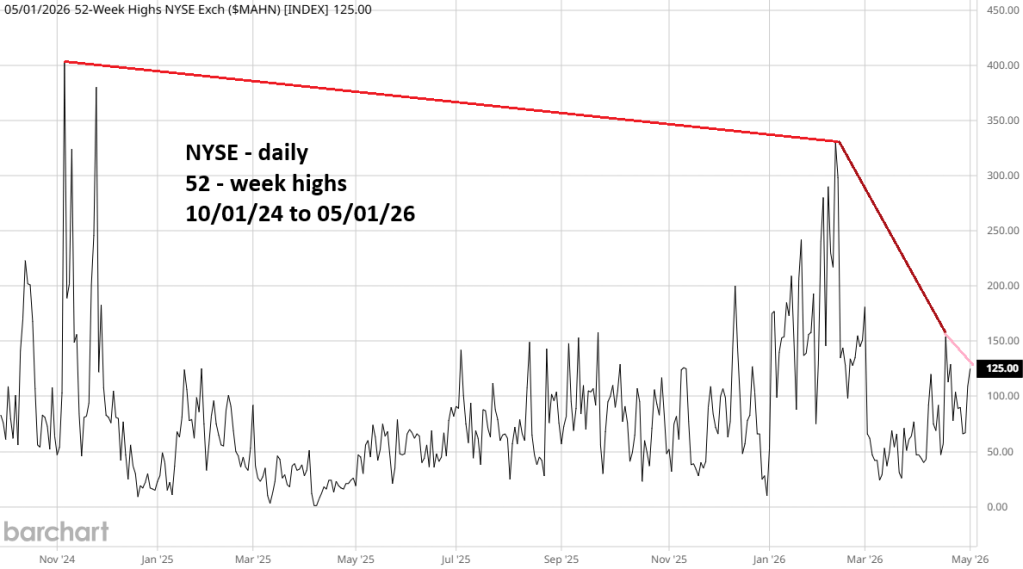
As of 05/01/26 there’s a double bearish divergence vs. the readings made in February 2026, which were a divergence on the levels reached in late 2024.
If the post 03/30/26 rally was the kickoff phase of a new bull market, there would be a much larger number of stocks making 52 – week highs. The opposite is occurring. The current move up in U.S. stocks is very narrow, primarily the Technology sector.
There’s a high probability U.S. stocks could decline during the week of 05/04/26 to 05/08/26.
