The 04/25/26 blog “Short-Term S&P 500 – Elliott Wave Count – 04/24/26” illustrated that the S&P 500 (SPX) could be in a developing Elliott wave – Impulse pattern since the 03/30/26 bottom.
The one – hour SPX chart courtesy of Trading View updates the Elliott wave count.
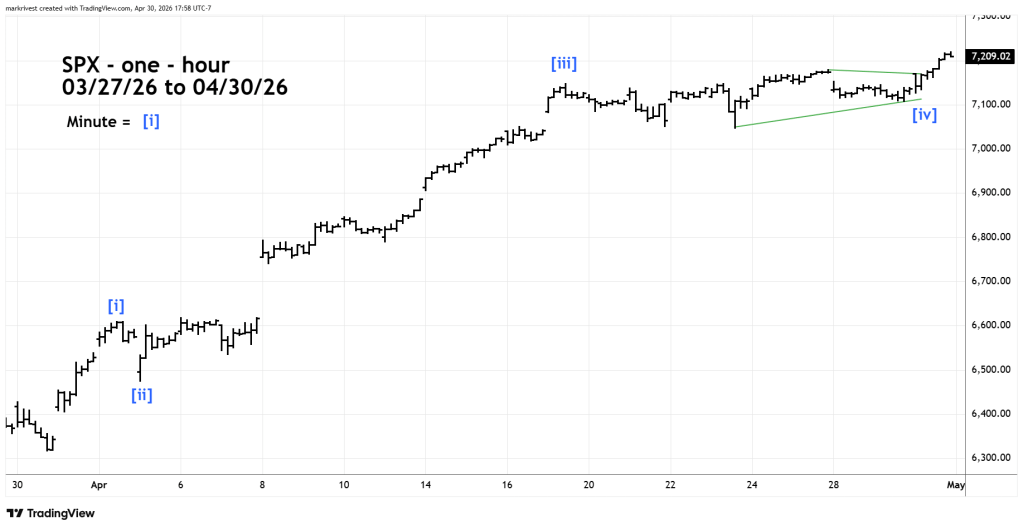
The 04/25/26 blog illustrated the 04/23/26 bottom as the termination point of an Elliott wave – Expanding Flat and as the termination point for the presumed Minute wave [iv]. It now appears the Expanding Flat may have been Minuette wave ( a ) of a developing Elliott wave – Horizontal Triangle.
The SPX – 15-minute chart zooms in on the presumed Horizontal Triangle.
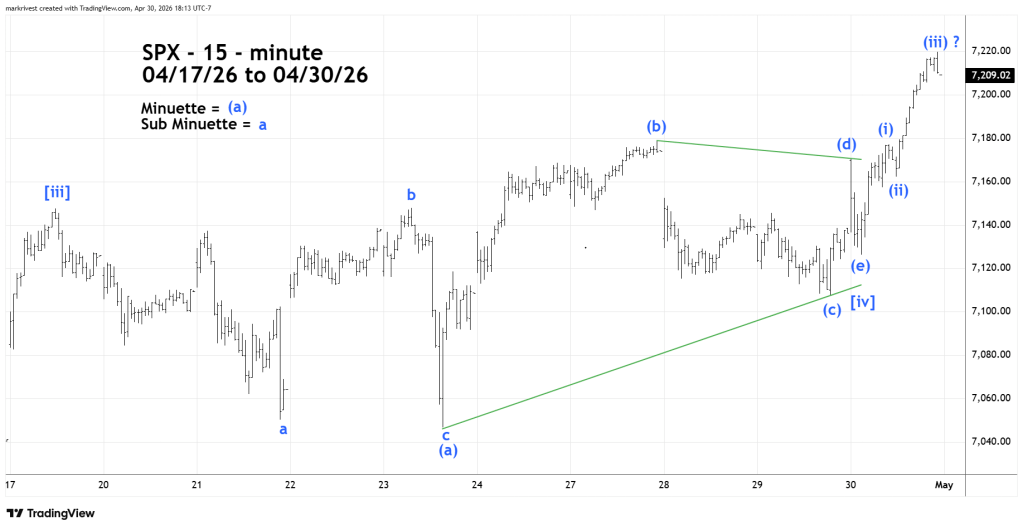
The Horizontal Triangle may have terminated at the 04/30/26 bottom. If so, the subsequent rally could be a post triangle thrust up.
This move up is probably Minute wave [ v ] of the developing Impulse pattern since the 03/30/26 bottom. Its possible Minute wave [ v ] could terminate on 05/01/26.
The 04/25/26 blog noted a broad topping zone could be in the 7,230 to 7,330 area.
