An enormous amount of evidence indicates the Natural Gas bear market since August 2022 could be at or near completion.
For six months Natural Gas has declined 75% wiping out more than a year of upside progress. Could there be more downside action? Perhaps, but an examination of evidence from all four market dimensions suggest a major bottom could be forming.
Almost all markets have seasonal patterns and the first question you have to ask is; what time is it on the market clock?
The Natural Gas Seasonality chart courtesy of EquityClock.com provides the answer.
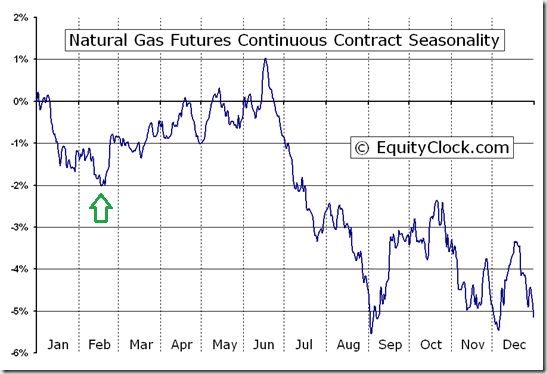
Mid – February to mid – June is a seasonally bullish period for Natural Gas and implies a bottom could be in place, and if not very soon.
The five – year weekly Natural Gas chart courtesy of BarChart.com examines momentum and sentiment evidence.
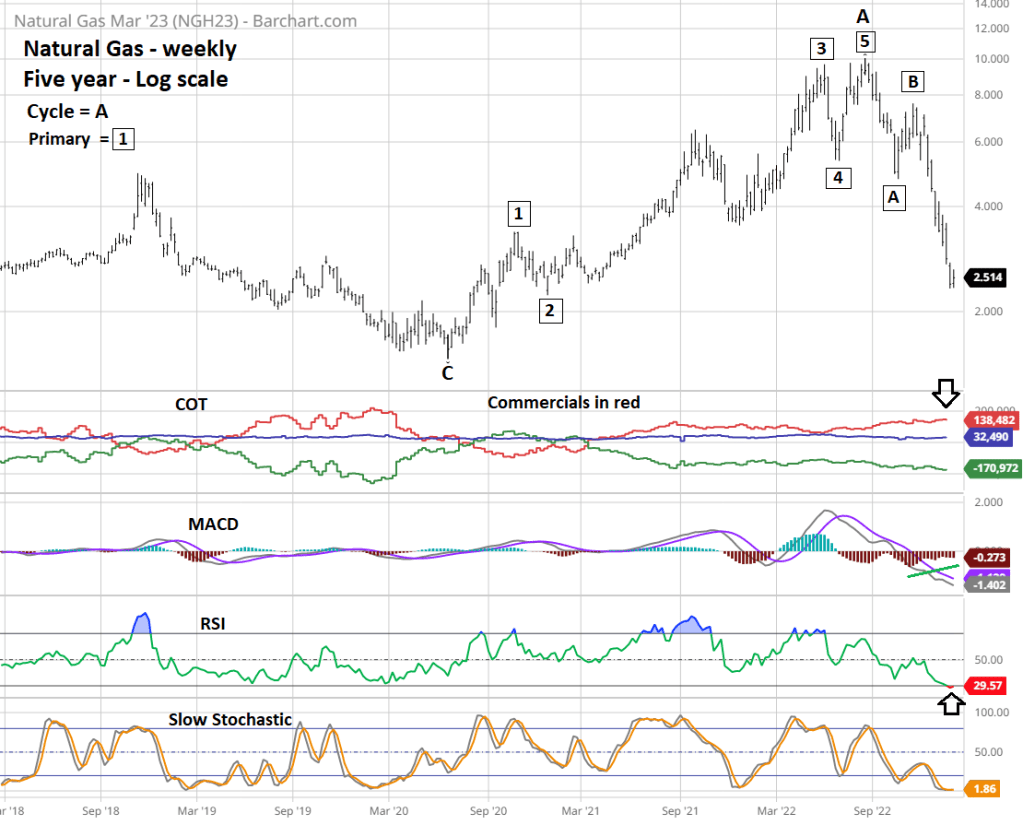
Sentiment evidence: Every week the U.S Commodities Futures Trading Commission issues a Commitment of Traders (COT) report which shows the aggregate holdings of different participants in the U.S. futures markets. The COT groups traders into three categories, Large speculators, Small speculators, and Commercials. The Commercials are the group you want to follow. They have the most money and are the most knowledgeable about the commodity they trade.
As of the week 01/16/23 to 01/20/23 Commercials had the largest net long position since October of 2020. Note they are not infallible and had a large long position in February 2020 four months before the Natural Gas bear market ended.
Momentum evidence: The weekly MACD – Histogram has a bullish divergence. Weekly RSI for the first time in over five – years has reached the oversold zone – below 30%. Weekly Slow Stochastic is extremely oversold.
Note that the bull market from June 2020 to August 2022 took the form of an Elliott impulse pattern.
The daily Natural Gas chart – symbol (NG1!) courtesy of Trading View focuses on the decline since August 2022.

Daily MACD has a bullish divergence and a bullish line crossover. Daily RSI has a bullish divergence and has crossed above its moving average line. Daily Stochastic is oversold.
The August to February drop has so far taken the shape of a clear Elliott wave Zigzag correction. Fibonacci evidence supports this theory. The presumed Primary wave “A” decline was 5.15 points. The drop from the presumed Primary wave “B” to the low made on 02/09/23 was 5.21 points, close to equal which is a typical Fibonacci relationship between waves “A” and “C” of a Zigzag correction.
The amount of evidence usually has a direct correlation to the degree of a potential market turn. For Natural Gas there’s evidence from all four market dimensions.
Time Dimension: Seasonally bullish mid-February to mid- June.
Sentiment Dimension: Commercials with the largest net long position since October 2020.
Momentum Dimension: Bullish divergences on MACD and RSI, with Stochastic oversold.
Price Dimension: Elliott five – wave bull market followed by three – wave bear market.
The evidence from the four market dimensions implies a major bottom could be forming.
