Today 02/14/23 the Dow Jones Industrial Average (DJI) made an early session high at 34,331.47 then decline for about 90 -minutes bottoming at 33,824.45. This could just be a small inconsequential drop. However viewed from an Elliott wave perspective it could be the completion of a pattern that began on 01/05/22.
The daily DJI chart courtesy of Trading View illustrates the action subsequent to the all-time high made in early January 2022.
The 02/08/23 blog “Fascinating Elliott Wave Pattern” noted that an Elliott – nine wave – Horizontal Triangle could be developing from the DJI high made on 01/05/22. Since 02/08/23 the DJI has meandered sideways possibly completing the multi – month Horizontal Triangle.
A subtle clue comes from the series of declining tops 01/13/23 to 02/14/23.
This particular presumed Horizontal Triangle is a contracting type with each successive top lower than the prior peak.
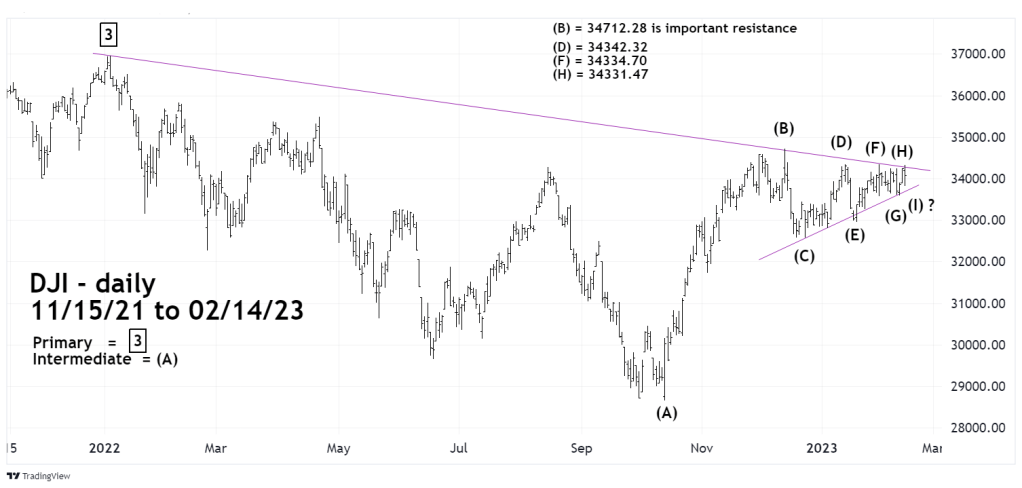
The final three tops are as follows: Wave (D) 34,342.32
Wave (F) 34,334.70
Wave (H) 34,331.47
The decrease is tiny yet very important, markets remember their price structure. A movement above a prior top would have invalided the pattern. The DJI appears to be whispering to us – Horizontal Triangle.
If within the next few trading days, the DJI moves above the high made on 12/13/22- wave (B) at 34,712.28 it could confirm completion of a thirteen-month Horizontal Triangle.
If it holds, the DJI low made on 02/14/23 at 33,824.45 could be the most important bottom for U.S stocks in 2023.
