Since March 2022 Crude Oil has been in a trading range between 126.00 and 92.00. Momentum signals and seasonal patterns suggest a new uptrend may have begun.
The daily Crude Oil chart – (CL2!) – continuous next futures contract in front – courtesy of Trading View illustrates the trading range.
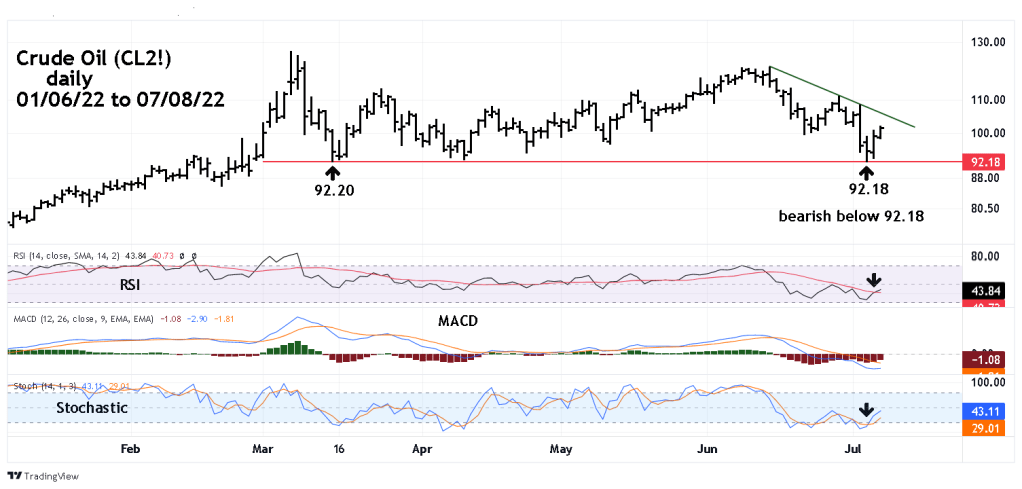
First note the double bottom at 92.20 and 92.18. A break below 92.18 in the next few days or weeks could trigger a significant decline.
Both daily RSI and Stochastics have bullish line crossovers, so far no MACD signal. On the bearish side of the coin none of the three momentum indicators had bullish divergences at 07/06/22 bottom.
Crude Oil seasonal patterns are bullish from July to August.
The next challenge for the bulls is to break above the declining trendline connecting the tops made; 06/14/22, 06/29/22, and 07/05/22.
A move above the declining trendline could open the door for a move up to the 120.88 peak.
