The decline in US stocks from January 2022 to June has brought weekly and monthly Stochastics into the oversold zone. The rally since the late June bottom could ease the oversold condition. Action from the S&P 500 (SPX) October 2007 to March 2009 bear market gives clues as to how long a post June 2022 rally could continue.
The monthly SPX chart courtesy of Trading View illustrates long-term momentum.
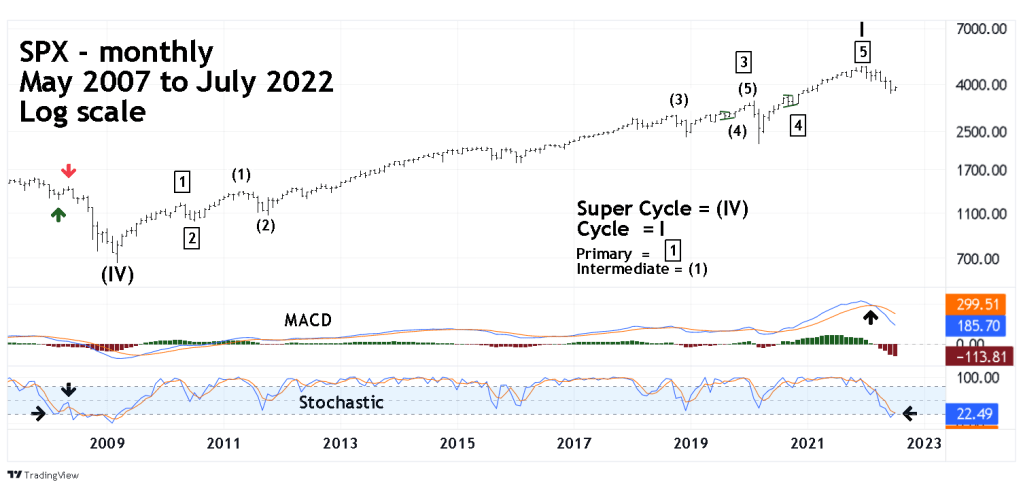
The long – term Elliott wave count from March 2009 to January 2022 indicates that the 13 – year bull market is probably complete. If so, the subsequent correction will most likely be in proportion of time and price to the bull move. The time of the decline could be three to five years. The retracement in price could bring the SPX down to the 1,200 to 1,300 level.
The monthly MACD had a bearish lines crossover in March 2022, and the lines could decline for more than one- year before reaching an oversold level.
The monthly Stochastic has reached the oversold zone and had a bullish lines crossover. These two signals imply the current SPX rally could continue for at least several weeks. The big question is , how many weeks?
Note the oversold Stochastic point made in March 2008. This was five months after the SPX October 2007 top. The SPX January 2022 to June decline is also five months.
The early 2008 SPX bottom came on 03/17/08 and rallied 44 – trading days topping on 05/19/09. The 9 – week rally was enough to relieve the monthly oversold Stochastic condition, setting the stage for the next phase of the bear market.
Adding 44 – trading days to the SPX 06/17/22 bottom targets 08/22/22 for a potential rally top.
Additionally, June to August rallies can set the stage for a seasonal September to October decline. Sometimes these seasonal declines can be very severe – note what happened in October 2008.
