Occasionally markets can turn on or near Full or New Moons. For stocks Full Moons tend to signal bottoms, New Moons tend to signal tops.
There’s a Full Moon on 07/13/22. The daily S&P 500 (SPX) chart courtesy of Trading View illustrates New and Full Moons since late 2021.
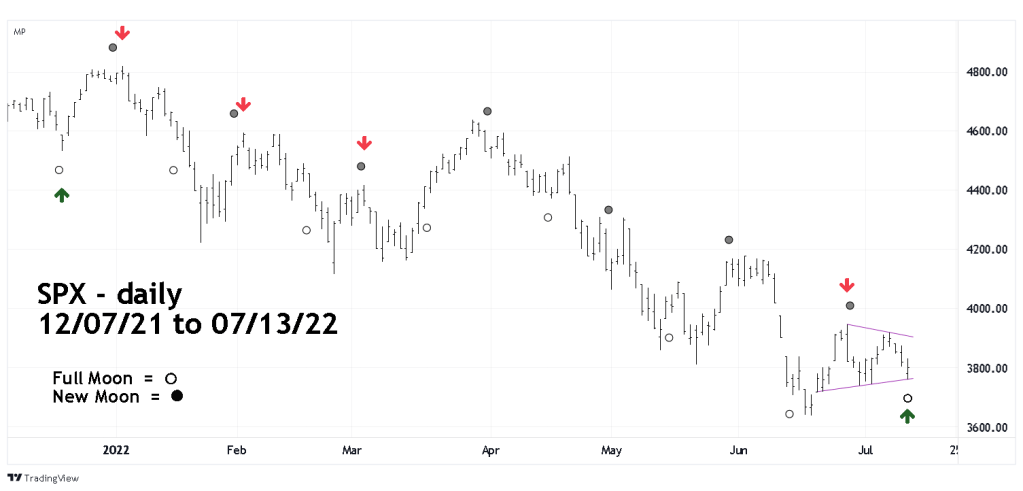
Using the parameters of plus or minus two trading days from a New/Full Moon reveals there have been five effective lunar turn signals since December 2021.
The turn dates are: 12/20/21 – bottom.
01/04/22 – top.
02/02/22 – top.
03/03/22 – top.
06/29/22 – top.
The hourly SPX chart zooms in on short-term trendlines.
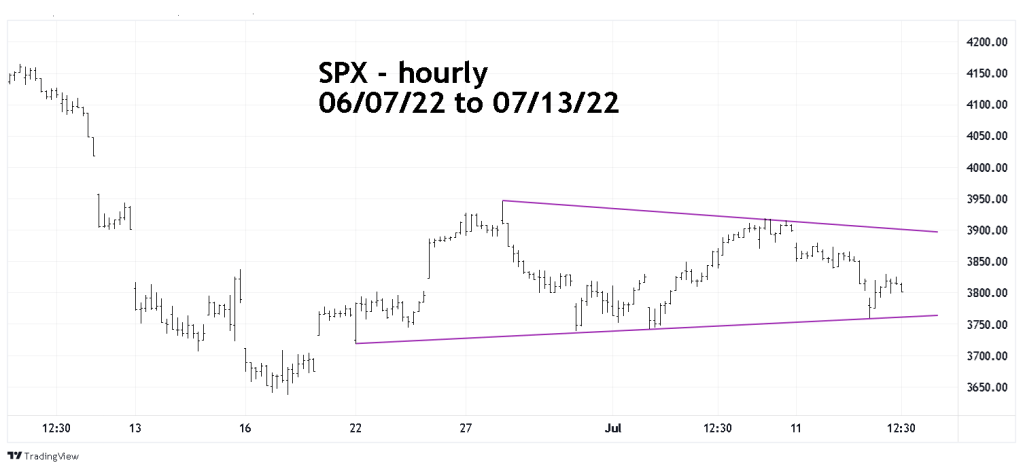
Just after the open of the 07/13/22 SPX session, a bottom was made at a trendline connecting the lows since the 06/22/22 bottom.
A break below the lower trendline could trigger a drop down to at least the 06/17/22 bottom at 3636.87. A move above the upper trendline could open the door for a rally at least up to the low 4100 area.
Also, the Full Moon on 07/13/22 is a Super Moon – a Full Moon at its closest approach to Earth. The view could be spectacular, especially at Moon rise.
