An examination of the S&P 500 (SPX) crashes in 1987 and 2020 could give clues to what may happen in late 2026.
The first daily SPX chart courtesy of Trading View examines the August to October 1987 crash.
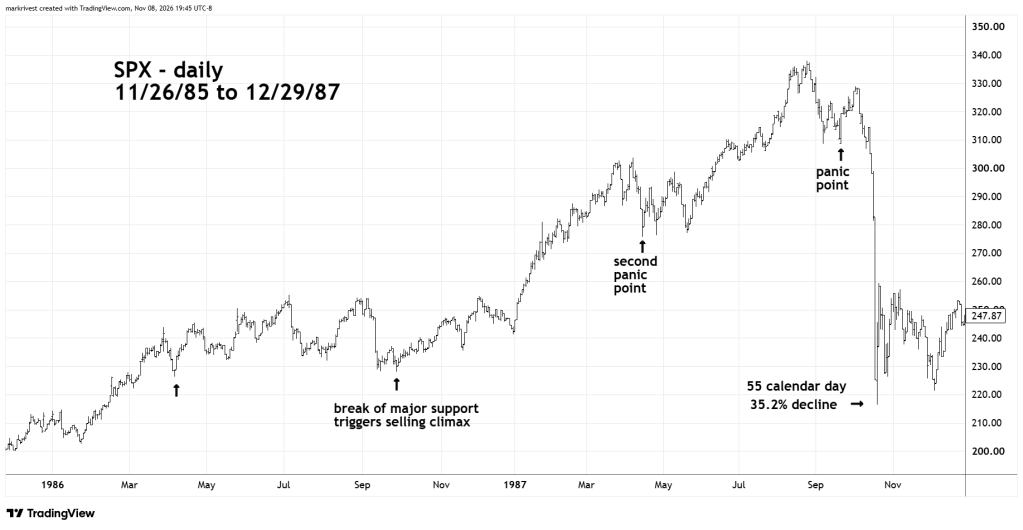
SPX had two panic points, the second panic point was the most significant, triggering the massive one day move down on 10/19/87.
The entire 35.2% decline after the 07/25/87 peak lasted a Fibonacci – 55 – calendar days.
Please note that the final part of the crash went below the starting point of the huge 1986 to 1987 bull move. This is typical of what frequently happens on any type of time scale. The move down wipes out an entire bull phase and then bottoms.
The break below the bull starting point usually causes maximum bearish sentiment, bulls finally surrender and the bear trend terminates.
The next daily SPX chart looks at the 2020 crash.
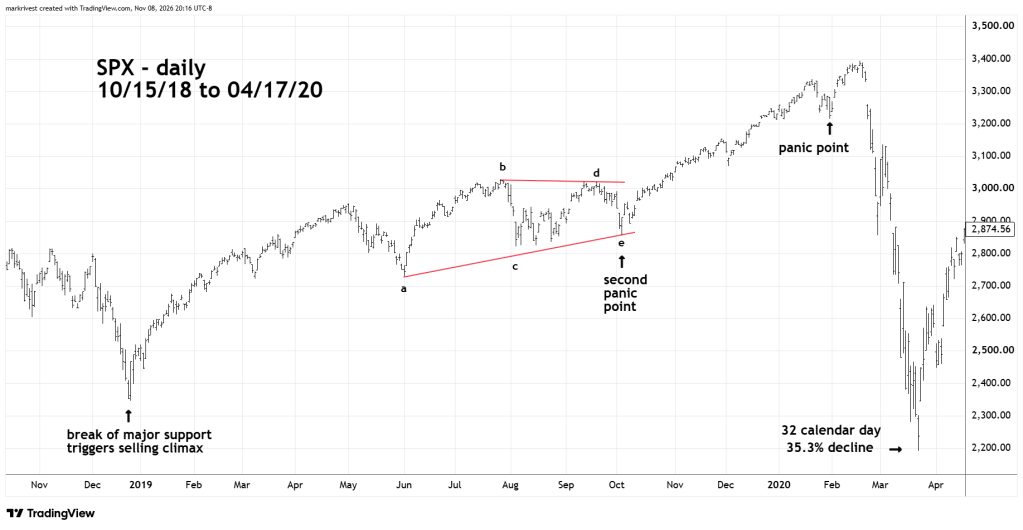
The decline percentage was almost the same as the 1987 crash. The speed of the drop was much quicker than 1987 – 32 calendar days vs. 55 calendar days.
Again, there were two panic points. The first is like an early warning signal. The Second panic point broke below the termination point of an Elliott wave – Horizontal Triangle.
The 2020 drop also went below the start of its 2018 to 2020 bull market, then the crash terminated.
The final SPX daily chart illustrates what could happen during the remainder of November 2026.
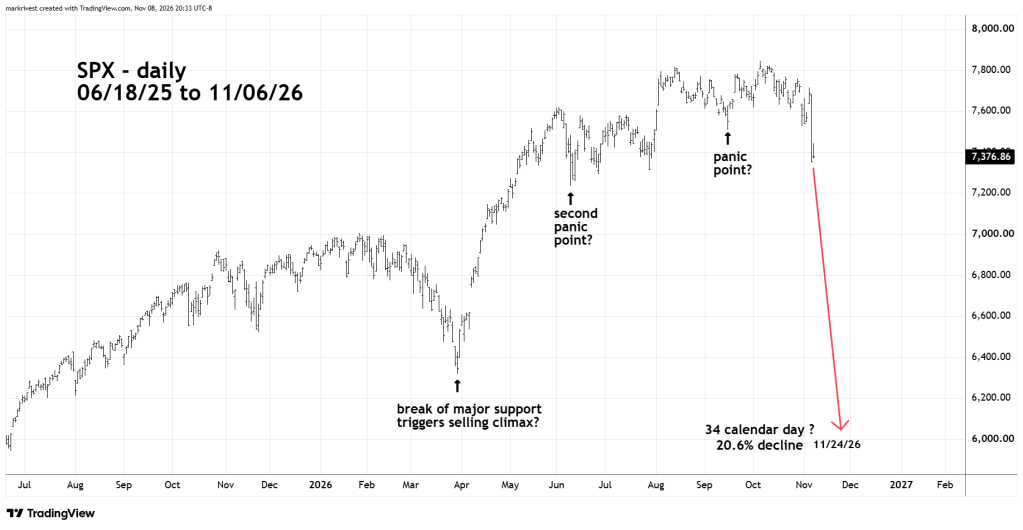
This website’s prior blog illustrated that the SPX -06/09/26 bottom was the panic point. It’s possible the large move down on 11/05/26 was a break of the first panic point, an early warning of what may be coming.
The break below the point of origin of the March to October 2026 bull move could trigger a selling climax.
Markets can sometime have turns on Full/New Moons plus or minus two trading days. There’s a Full Moon on 11/24/26 and is 34 – calendar days after the 10/06/26 peak, this is close to the 2020- 32 – calendar day crash.
Forecast could be in doubt if SPX moves above its 11/04/26 peak.

