A break below a key S&P 500 (SPX) support level could soon trigger a mini crash.
From August to October 1987 – SPX declined 35%. In the Covid crash of 2020 – SPX fell 35%. In both the 1987 and 2020 crashes SPX broke below key support, fell rapidly and bottomed just below the next key support level. In 2026 the second SPX key support level is only about 20% below the SPX high made in October 2026. Hence, only a possible “mini” of 20% vs. 35%. This website’s next blog will examine SPX price structures in 1987 and 2020 vs. 2026.
The S&P 500 – Point & Figure (PF) chart courtesy of StockCharts.com illustrates potential support zones.
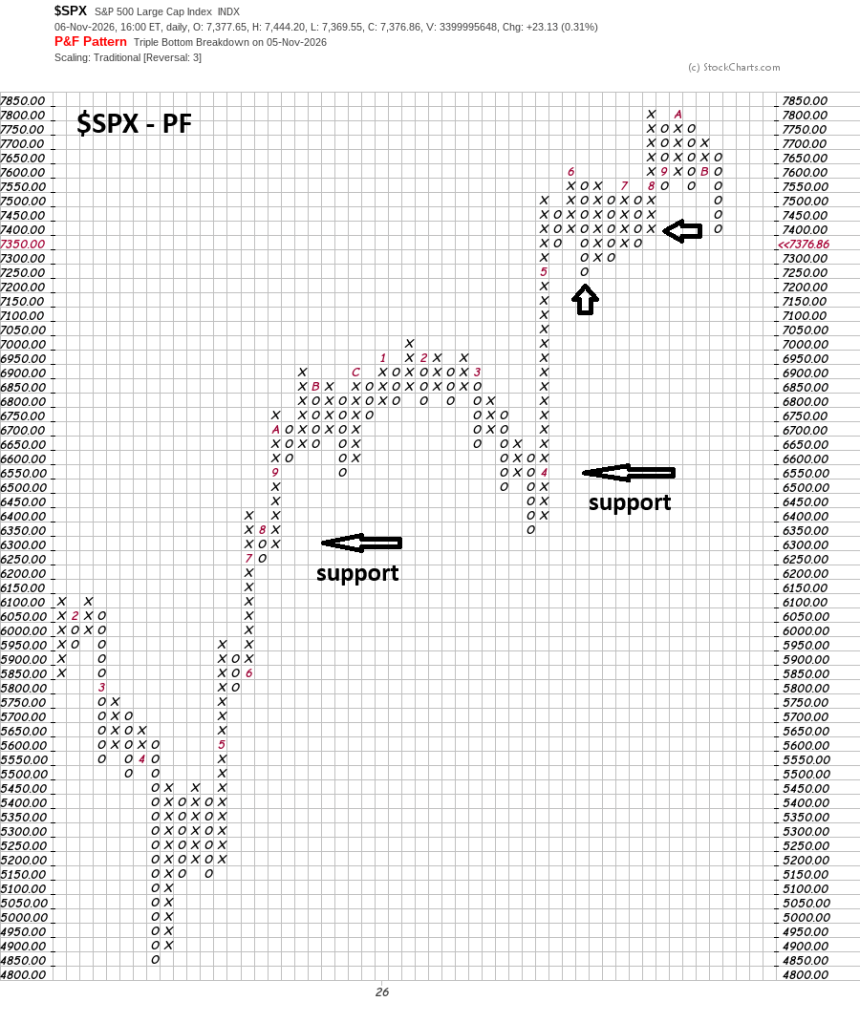
Point and figure charts strip away time to focus purely on price direction, which makes them useful for spotting breakouts, setting price targets, and filtering out market noise. Moves up are designated with “X’s”, moves down are designated with “O’s”.
Note that SPX as 11/06/26 has found support on a long row of “X’s” and “O’s”. Below that level support weakens. The single “O” at 7,250 is key support, below is nothing but air – no chart support.
The next potential support is around 6,550, if this does not hold it could trigger a move to the second key support at 6,350. Note the single “O” at this level. A break below the second key support could open the door for a move to 6,300 to 6,250. Note there is only a row of three “X’s” and “O’s” so it’s possible a mini crash could turn to a major crash.
The quarterly SPX chart courtesy of Trading View examines what could happen from the perspective of the Strat methodology.
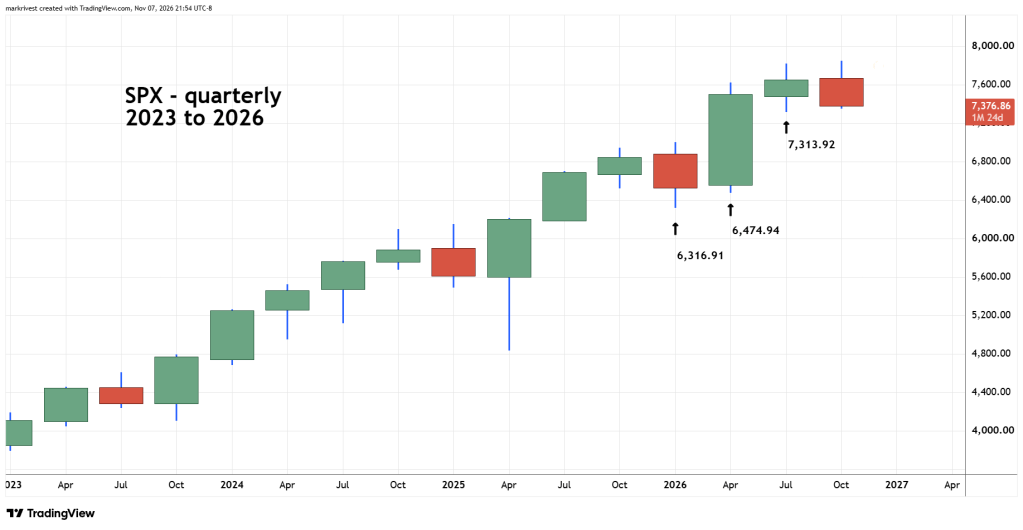
A main feature of the Strat method is that a break below/above the prior bar high/low targets a move to the next prior bar high/low. This method applies to all time scales.
In this case an SPX move below 7,313.12 opens the door for a move down to the prior bar low at 6,474.94. The next target below that level is 6,316.91.
The daily SPX chart gives a more detailed picture of what may happen.
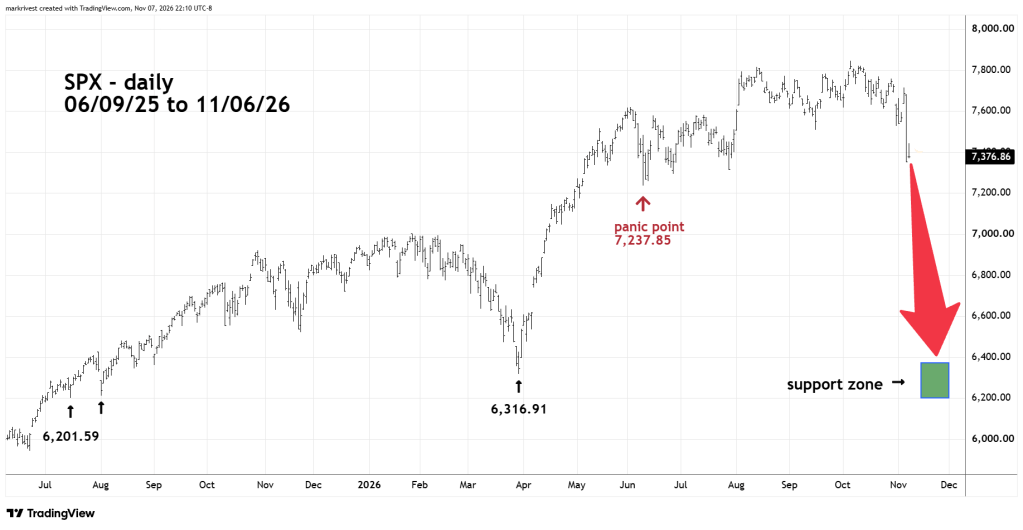
A break below the 06/09/26 low of 7,237.85 could trigger a sharp decline, as there is no significant chart support below that level.
The second key level is at 6,316.91 the 03/30/26 bottom. A potential crash bottom could be made in the low 6,200 area. If that does not hold, there could be a major crash down to the bottom made in April 2025.
The fuel for a potential mini crash could come from the selling of technology stocks. This sector led the bull market from 2025 to 2026 has been leading the way down since its peak in early October 2026.
Bulls eye target date for a potential mini crash bottom is 11/24/26 – Full Moon day.

