Since their all-time highs the three main U.S. stock indices have declined as follows.
S&P 500, down 3%.
Dow Jones Industrial Average, down 5%.
Nasdaq Composite (IXIC), down 8%.
The main reason IXIC is down the most is because of the technology sector. As of 10/30/26 the Technology sector ETF – XLK was down 11% from its all-time high.
Most of the U.S. stock market is bearish with technology leading the way down. Health care, consumer staples, and energy stocks are making new highs.
On 10/30/26 IXIC had one of its largest down days in 2026. Could this be the start of a massive IXIC decline? Perhaps, however, internal momentum suggests IXIC could have a short-term rally.
The daily IXIC chart courtesy of Trading View illustrates its action since April 2026.
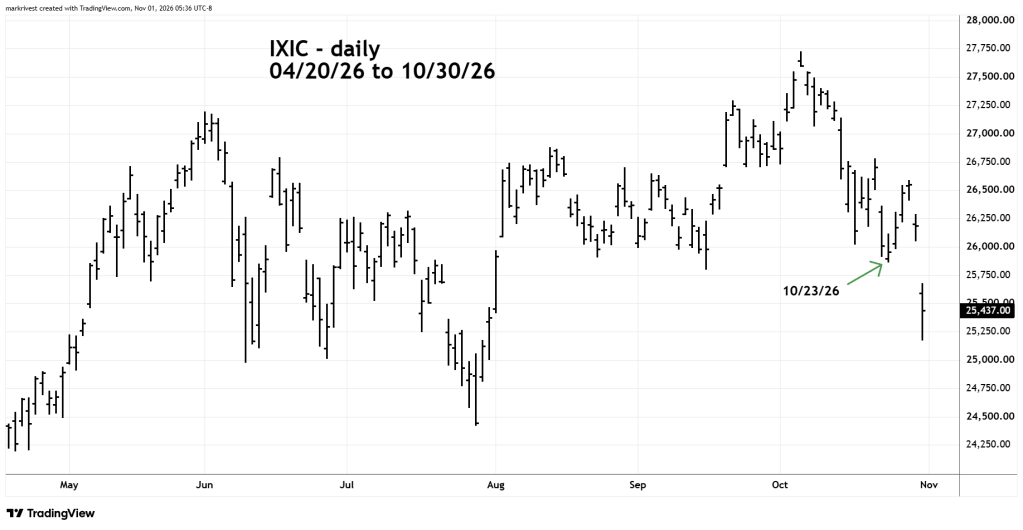
On 10/30/26 IXIC gapped down and broke below its bottom made on 10/23/26. Underneath the surface of price something else happened.
The Barchart.com chart of Nasdaq 52 – week highs minus 52 – week lows ($MADQ) shows internal momentum.
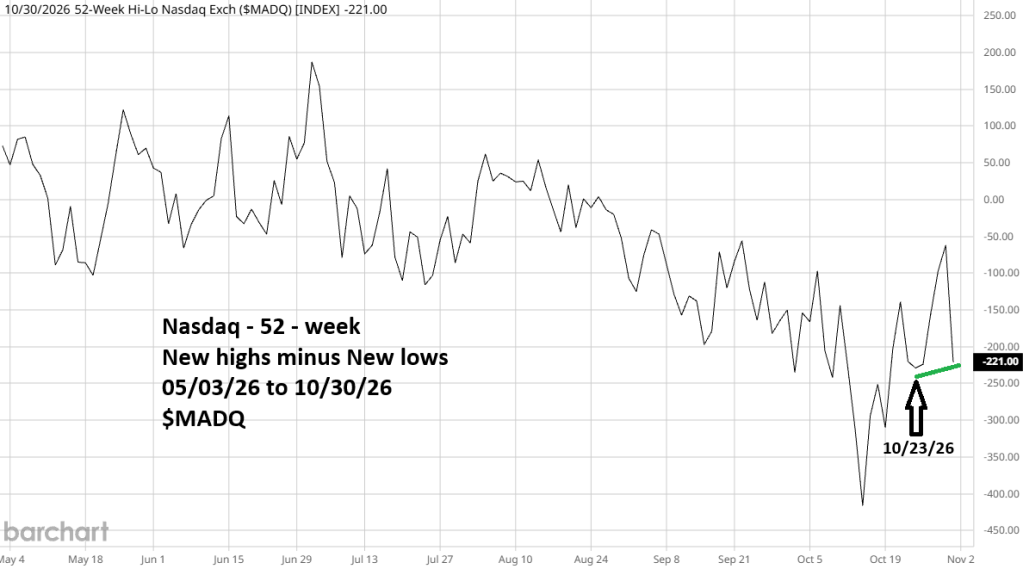
On 10/30/26 price had a very large move down, net highs minus lows failed to go below its level reached on 10/23/26. This implies IXIC could rally for at least a few days.
The ideal signal for a final U.S. stock market peak could occur if the S&P 500 makes a new all-time high unconfirmed by the Dow Jones Industrial Average, and the Nasdaq Composite.

