On 06/03/26 the technology stock ETF (XLK) reached its all-time high. After 06/03/26 – S&P 500 (SPX) continued to make new highs and reached their peak on 08/13/26. The bearish divergence of XLK to SPX is significant because technology stocks have been strongest sector of the U.S. bull market that began in April 2025.
SPX from April 2025 to August 2026 climbed 60%. XLK from April 2025 to June 2026 climbed 129%!
XLK relative weakness could be the prelude to a broader U.S. stock market decline. However, the actions of XLK during the week of 09/14/26 to 09/18/26 casts doubt on that theory.
The financial stock sector ETF (XLF), energy stock sector ETF (XLE), and XLK daily charts courtesy of Trading View illustrate their relationship.
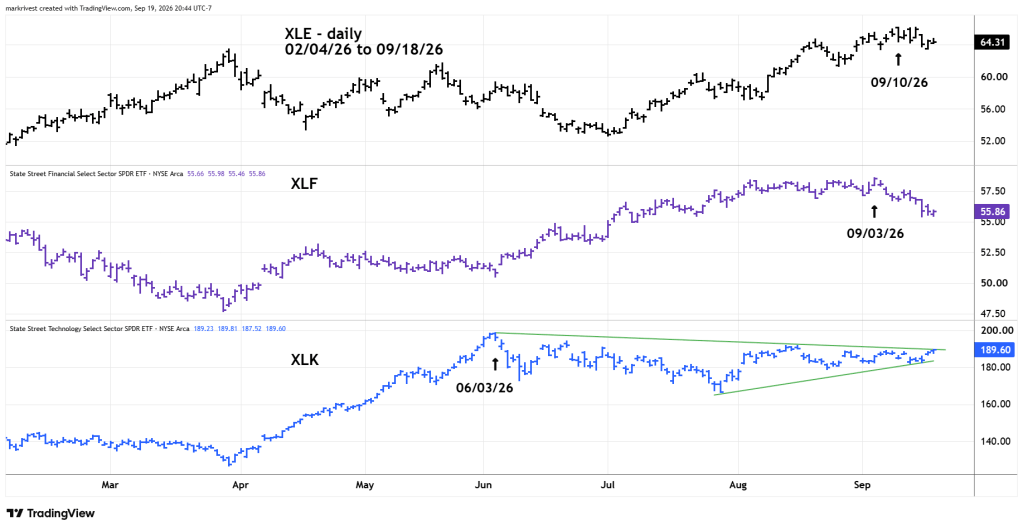
Just after XLK peaked on 06/03/26 – XLF began a new rally and reached its all-time high on 09/03/26. XLE didn’t begin its newest bull move until early July and peaked on 09/10/26.
Please note the action of XLK from late July, a rally and what appears to be a base prior to another rally.
The daily XLK and SPX examines their relationship.
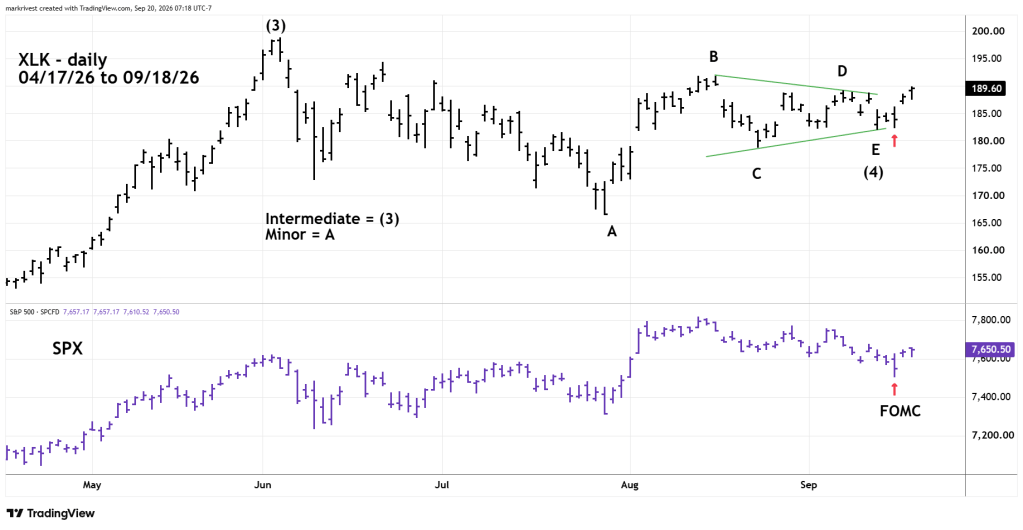
What happened on 09/16/26 is very important. The U.S.- FOMC raised short-term U.S. interest rates. This was the single most bearish event for U.S. stock in 2026; it could have triggered a decline affecting almost all U.S. stocks. Yet XLK failed to go below its bottom on 09/14/26.
SPX has since retraced its entire post-FOMC decline, while XLK is now outperforming SPX on the upside.
From an Elliott wave perspective XLK action from 06/03/26 to 09/14/26 appears to be a completed Elliott wave – Horizontal Triangle. These structures are net sideways corrections to the main trend which in this case is up.
XLK is most likely now in a post triangle thrust up. The termination point of this thrust can be estimated by the widest part of the Horizontal Triangle. In this case it’s the presumed Minor wave “A” which was 32.27 points. Added to the Minor wave “E” bottom of 182.08 targets XLK 214.35 as a potential peak.

