The 08/16/26 blog “Crude Oil Near-Term Target – 95.00” noted Crude Oil’s broad resistance area was 95.00 to 100.00.
The 09/12/26 blog “Crude Oil Reaches – 100.00” noted “On 09/11/26 Crude Oil reached 100.03, almost the exact level of the 05/18/26 peak of 100.10.” Also noted, “Another price spike up from current levels could quickly bring Crude Oil up the 130.00 area”.
On 09/15/26 Crude Oil moved above 100.10 and quickly peaked at 101.69. The subsequent sharp decline from that peak could be the start of a multi-week decline.
The daily continuous Crude Oil futures chart (CL2!) updates the action.
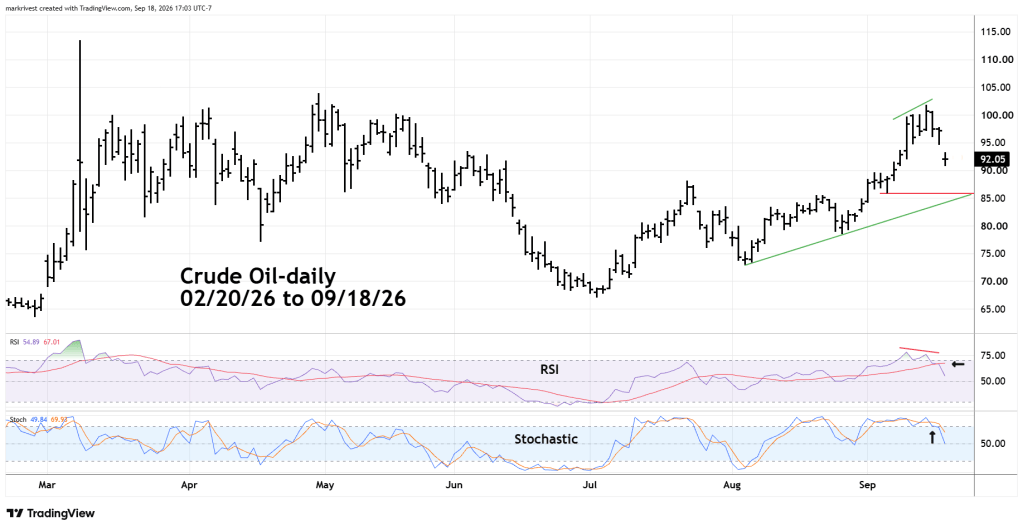
Unlike stocks, commodities rise on fear resulting in price spikes with maximum RSI readings. This is what occurred at the 03/09/26 Crude Oil peak. Secondary commodity peaks are more likely to occur with bearish momentum divergences.
On 09/15/26 there was a daily RSI bearish divergence vs. the level recorded on 09/10/26. RSI has now moved below its moving average line, and daily Stochastic has a bearish line cross.
Important support is at the 09/04/26 bottom of 85.92. A break below this level and the rising trendline could trigger a move to at least 65.00.
The weekly energy stock ETF (XLE) chart illustrates its long-term view.
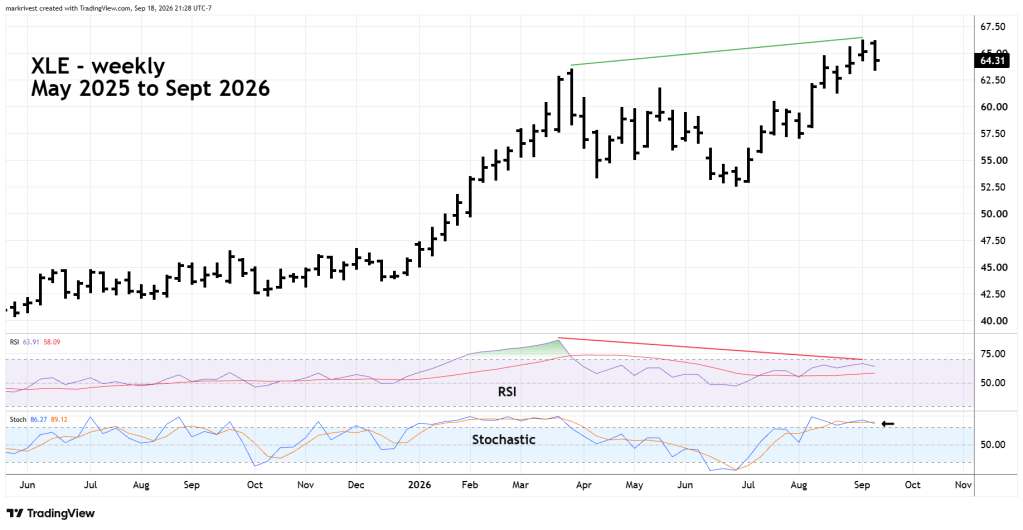
The September price peak has a significant RSI bearish divergence vs. the March peak. Weekly Stochastic has a bearish line cross in the overbought zone which begins at 80.00.
Crude Oil seasonal patterns are bearish into December.
Momentum evidence and seasonal patterns strongly suggest that Crude Oil and energy stocks have begun a multi-week decline.

