Recent S&P 500 (SPX) movements have terminated at very interesting levels.
The hourly SPX chart courtesy of Trading View shows the action from July to September.
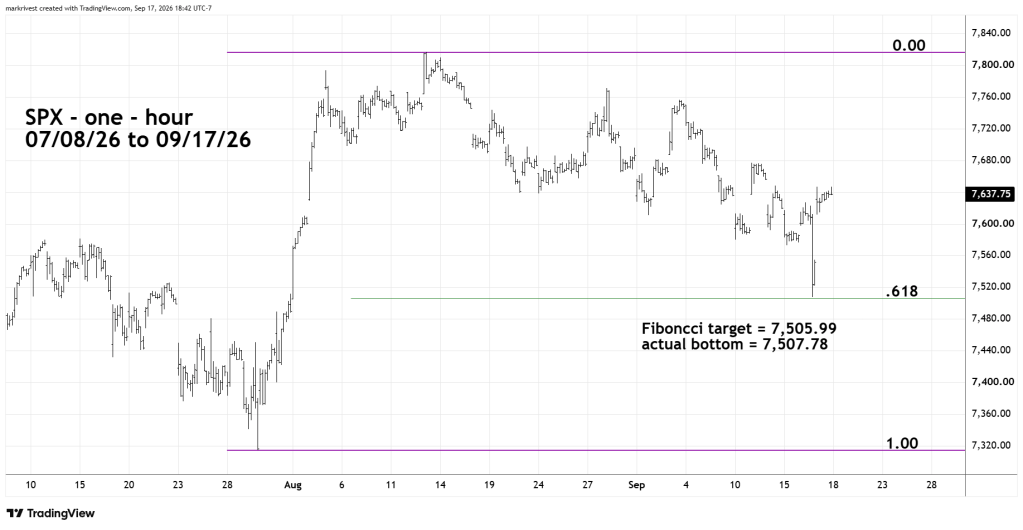
After the U.S. – FOMC decision to raise interest rates the SPX plunged more than 100 – points. It looked like the bears would continue the downward rampage until the end of the regular trading session. The area where the bulls staged a counterattack is amazing.
The decline ended at an almost exact .618 Fibonacci retracement of the July to August rally.
The subsequent rally was equally amazing.
The SPX – 15 – minute chart zooms in on what’s happened since early September.
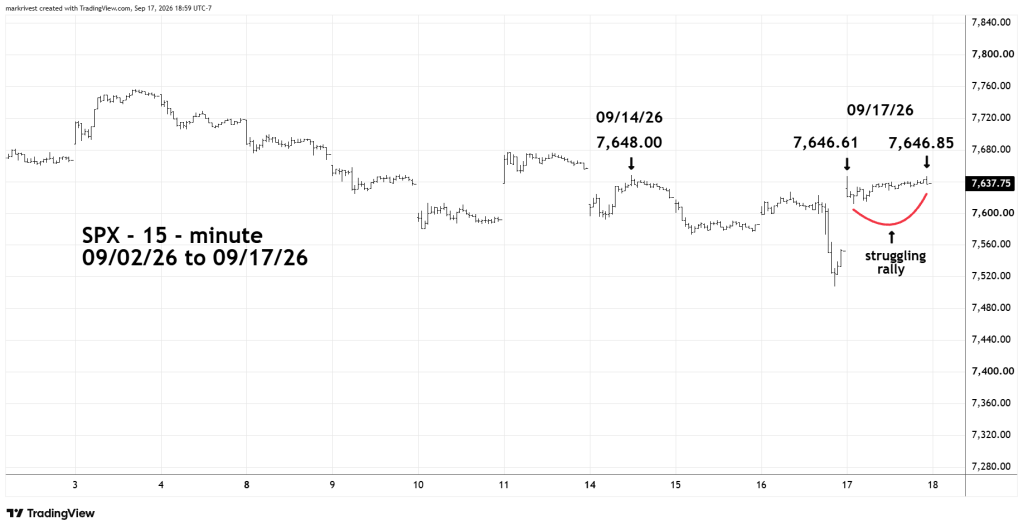
On 09/17/26 SPX opened the session more than 120 – points above the 09/16/26 bottom. It looked like the bulls could run wild to the upside, yet a peak was made in the first minute of regular session trading. This level is interesting because it was almost the peak reached on 09/14/26. This is a Fibonacci one to one retracement – equality.
Subsequently SPX experienced a minor decline then a very slow rally back up to the 09/14/26 peak.
An SPX move above 7,648.00 is potentially bullish.
An SPX move below the bottom at 7,507.78 could trigger a multi-week decline.
The weak upside action after the first trading hour of 09/17/26 strongly implies a move down on 09/18/26.

