The 08/16/26 blog “Crude Oil Near-Term Target – 95.00” noted “Momentum and Elliott wave structure imply Crude Oil could reach 95.00 in early September 2026”.
Since then, price has risen, yet not as robust as expected. Seasonal and fundamental factors could soon bring downward pressure on price.
The WTI Crude Oil Futures Seasonality chart courtesy of EquityClock.com illustrates what could happen in the next few months.
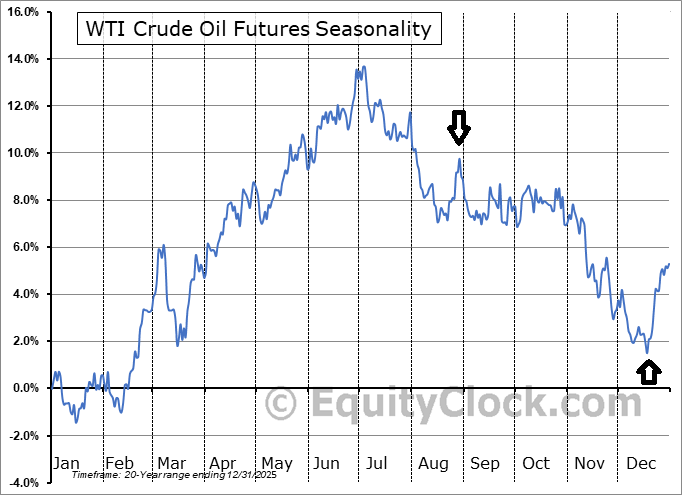
Note the seasonal spike up from mid to late August. This scenario fits in with short-term bullish momentum and Elliott wave structure. However, the short-term bullish seasonality may have ended or could soon end.
The fundamental factor concerns reports of activity in the Strait of Hormuz.
Presumably, last week the transit of oil tankers through the Strait of Hormuz rose more than 30 percent. If oil transits in this area return to prewar levels, Crude Oil price could have a considerable drop. On the bearish side, just one attack on an oil tanker could reignite fears and a rise in price.
The daily continuous Crude Oil futures (CL2!) chart courtesy of Trading View updates its action.
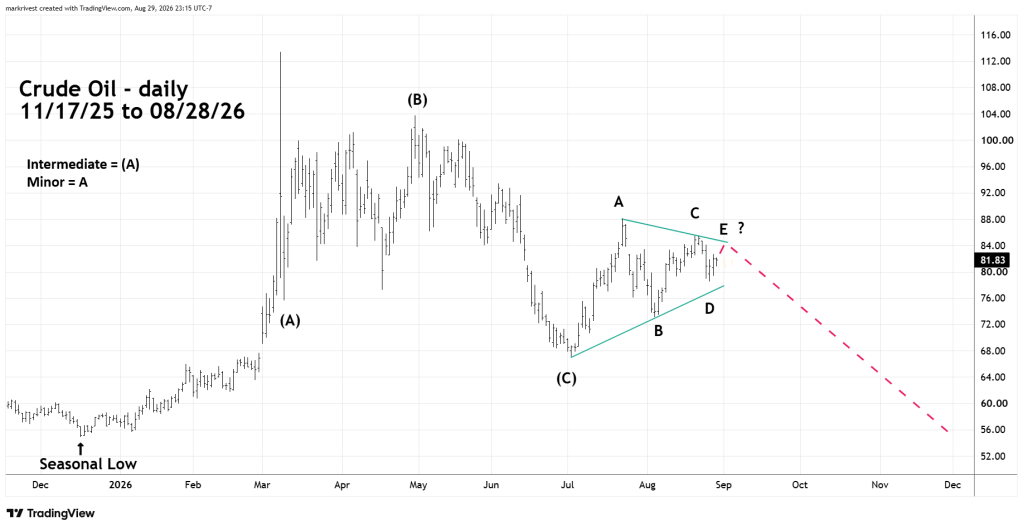
The movement after the early July 2026 bottom appears to be an Elliott wave – Inverse Horizontal Triangle. These are net sideways structures composed of five sub waves that correct the progress of the main trend. In this case the main trend is down.
The presumed Minor wave “E” could be complete or very close to completion.
Important levels to watch.
A move above 08/21/26 peak at 85.46 is bullish.
A move below 08/05/26 bottom at 73.10 is bearish.

