U.S stocks on 08/28/26 had a sharp spike up followed by a deep decline. This movement could mark an important secondary peak.
The 15 – minute S&P 500 (SPX) chart courtesy of Trading View shows what’s happened with this index since it’s all-time high on 08/13/26.
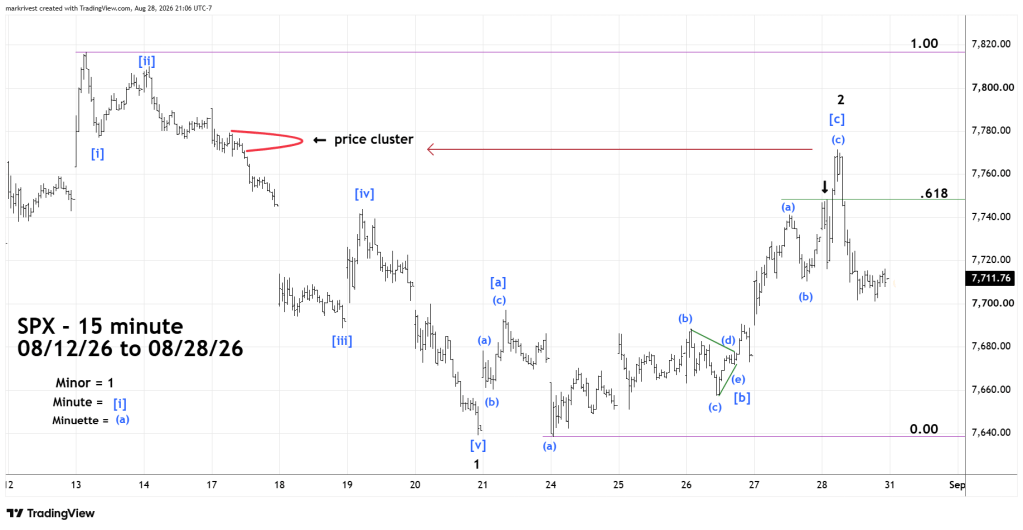
The SPX move to marginal to a new low on 08/24/26 looked like it could be the second part of an Elliott wave – Expanding Flat correction. What developed was a fascinating Combination wave.
The first part of this structure labeled Minute wave [a] is a Single Zigzag. The choppy sideways movement from 08/21/26 to 08/26/26 is a Horizontal Triangle – labeled Minute wave [b]. The subsequent rally labeled Minute wave [c] of Minor wave “2” for clarity is illustrated as a Single Zigzag. Please note that the move up from 08/26/26 to 08/28/26 further subdivides into Double Zigzag.
The prior blog “In the Lunar Zone – August 2026” noted.
“There’s a Full Moon on 08/28/26. An SPX rally to the Fibonacci .618 retrace area could be an important secondary peak”.
On 08/28/26 at 10:00 AM – EDT there was a U.S. economic report that triggered an SPX rally to 7,748.25. The exact Fibonacci .618 retracement of the 08/13/26 to 08/24/26 decline is 7,748.50.
Subsequently SPX experienced a sharp drop, and it looked like an important peak was in place. The stock bulls disagreed and started another rally. Fibonacci analysis is a widely used trading tool, the logical place for a bearish stop loss order is just above the 7,748.25 level. The triggering of stop buy orders and possibly new long orders pushed SPX up to a price cluster area.
SPX then experienced a deep decline. At the end of 08/28/26 SPX was below the bottom of the post 10:00 AM – EDT decline.
Monday August 31 is the last trading day of the month. Typically, SPX is bullish on the last trading day of the month – stock fund managers are purchasing top performing stocks. This is referred to as “Window Dressing”.
If SPX ends the 08/31/26 session above the 08/28/26 session close, it may only be a pause in a developing bear market.

