The 08/22/26 blog “First Wave Down – 08/21/26” noted “The “buy the dip” stock bulls of 2026 probably view the recent drop as another great opportunity and could push SPX up to the 7,740 to 7,760 area.”
This target zone has been reached. An important secondary peak could occur on 08/27/26 or 08/28/26.
The hourly S&P 500 (SPX) chart courtesy of Trading View updates the action.
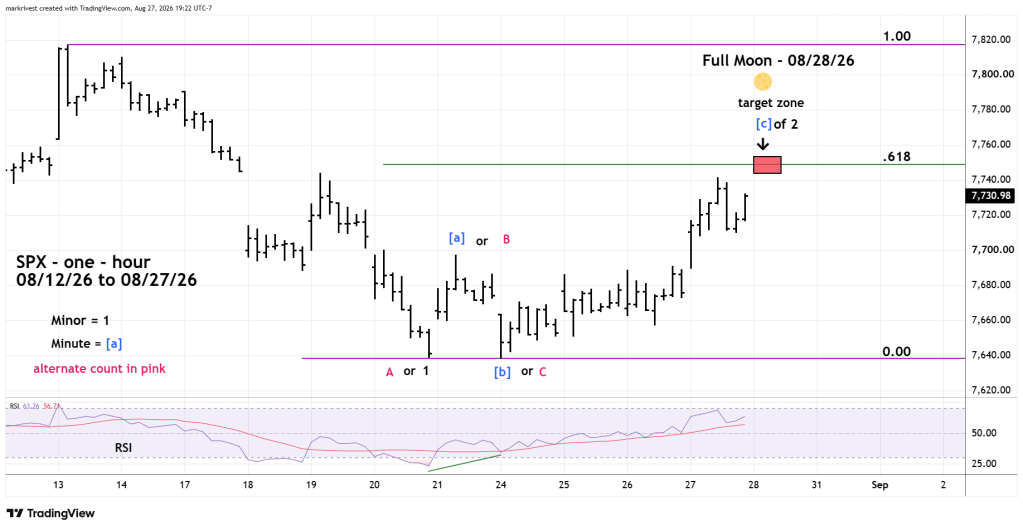
On 08/20/26 SPX completed a clear Elliott – Impulse wave. On 08/24/26 SPX made a marginal new low. This could be a completed Elliott wave – Single Zigzag. If so, SPX could be on the way to a new all-time high.
The more likely wave count is that an Elliott wave – Expanding Flat – wave “2” is developing or possibly already complete. If still under construction the area around Fibonacci .618 retrace of the recent drop could be a top.
Sometimes markets can turn on Full/New Moons plus or minus two trading days.
The 08/13/26 blog “Watching for a Single Top – Part- Two” noted that since early May 2026 only one of the prior six lunar signal had been ineffective. Subsequently the 08/12/26 New Moon was effective in signaling the SPX 08/13/26 peak.
There’s a Full Moon on 08/28/26. An SPX rally to the Fibonacci .618 retrace area could be an important secondary peak.

