Broad U.S. stock market seasonals patterns usually have peaks in April or May then a decline into October. The old saying “Sell in May and go away”. There are of course exceptions to this broad pattern. Two fascinating instances could provide clues to what may happen later in 2026.
The weekly Dow Jones Industrial Average (DJI) chart courtesy of Trading View shows what happened in 1929.
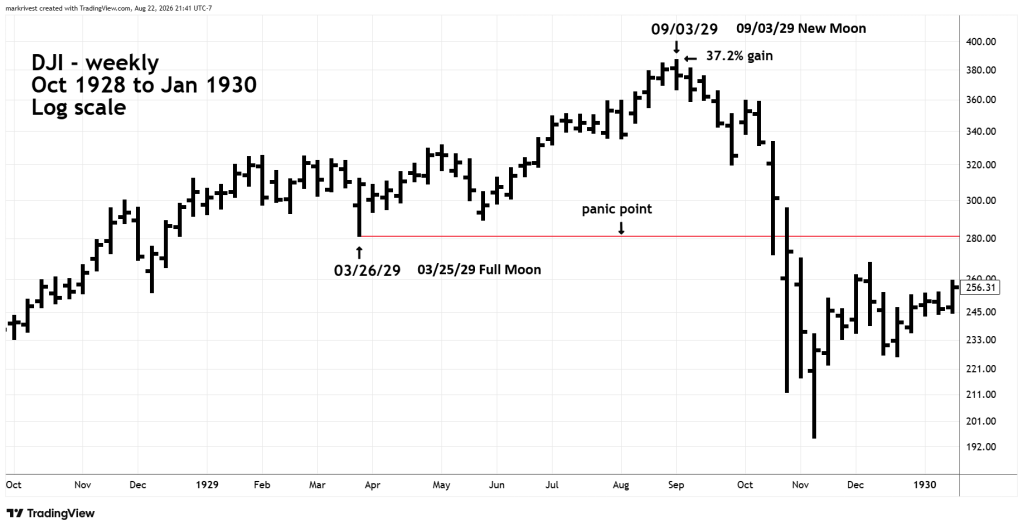
On 03/26/29 one day after Full Moon DJI completed a Minor correction. The subsequent rally lasted a few weeks, and the next decline appeared to be the start of a seasonal May to October decline. In the broader context the DJI was in the eighth year of a stock buying mania and the bulls were able to overcome seasonal trends.
The massive bull market terminated on 09/03/29 the same day as a New Moon. The gain from the correction bottom in March 1929 was 37.2%.
Note that the center of the subsequent huge decline was the March bottom.
The next weekly DJI chart illustrates the action in 1987.

A minor correction bottom occurred on 04/27/87 one day before New Moon. DJI then rallied 26% ending on 08/25/87 one day after New Moon. The bottom made in April 1987 was the center point of the subsequent crash.
The next weekly DJI chart brings us to the current year.
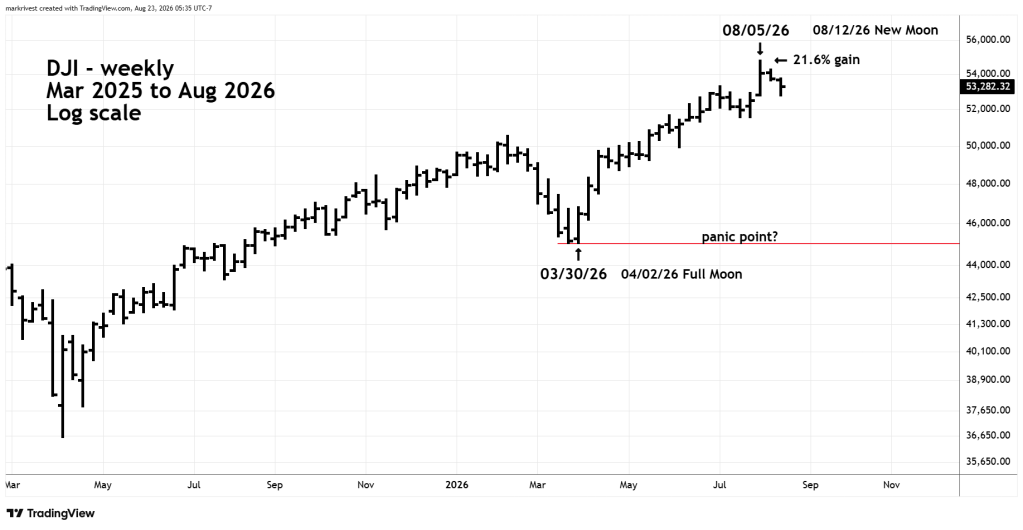
The DJI bottom was on 03/30/26 two days before Full Moon and then rallied 21.6% into a 08/05/26 peak. The New Moon was one week later 08/12/26, one day before the S&P 500 peak.
In the short-term DJI and S&P 500 could rally above their respective August 2026 peaks.
If they fail to make new highs, a break of the 03/30/26 bottom in October 2026 could trigger a selling panic.

