This website prior blog noted.
“SPX is declining in a clear Elliott – Impulse pattern. If so, this could be the first wave down of a larger developing five wave pattern.”
The S&P 500 (SPX) rally on 08/21/26 confirms this five-wave pattern is complete and could be just the start of a multi-week decline.
The 30 – minute SPX chart courtesy of Trading View updates the intraday action.
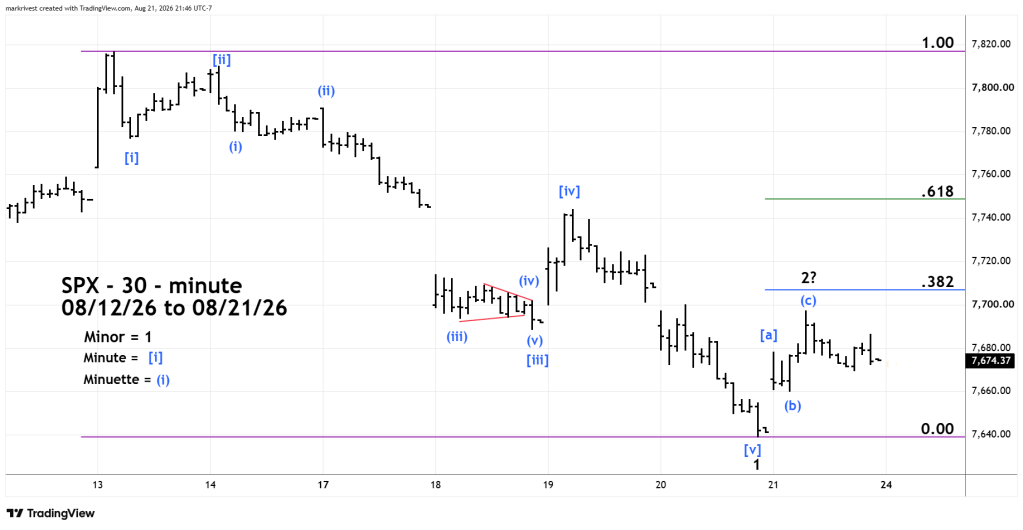
The SPX move down from 08/13/26 to 08/20/26 is a very clear Elliott Impulse pattern. Please note the details of the presumed Minute wave [iii]. Minuette wave (ii) is an Expanding Flat, Minuette wave (iv) is a Horizontal Triangle. Also note the gap in Minuette wave (iii). From an Elliott wave perspective this is the center of the drop from 08/13/26 to 08/20/26. This is a third of a third wave and they are usually the strongest part of an Impulse pattern.
The move up on 08/21/26 has so far taken the form of an Elliott wave – Single Zigzag. However, the move up has yet to retrace even .382 of 08/13/26 to 08/20/26 decline.
Typically wave “twos” retrace about .618 of wave “one”. The reason is that most market participants believe the first movement of a trend change is only a correction of the prior trend. In this case up.
The “buy the dip” stock bulls of 2026 probably view the recent drop as another great opportunity and could push SPX up to the 7,740 to 7,760 area.
Further upside action may only last one day.
A move below the bottom of 08/20/26 within the next few trading days could trigger a multi-week decline.

