Late in the 07/29/26 trading session U.S. stocks had a sharp and deep decline. On 07/30/26 bulls relentlessly pushed stock indices higher. Early in the 07/31/26 main session stocks peaked then had another sharp drop. It looked like the bears had taken control, yet before the first hour of the session was complete bulls began another steady rally.
Will the bull’s ravenous appetite ever be satisfied?
The daily NYSE Composite (NYA) chart courtesy of Trading View shows a possible Elliott wave count.
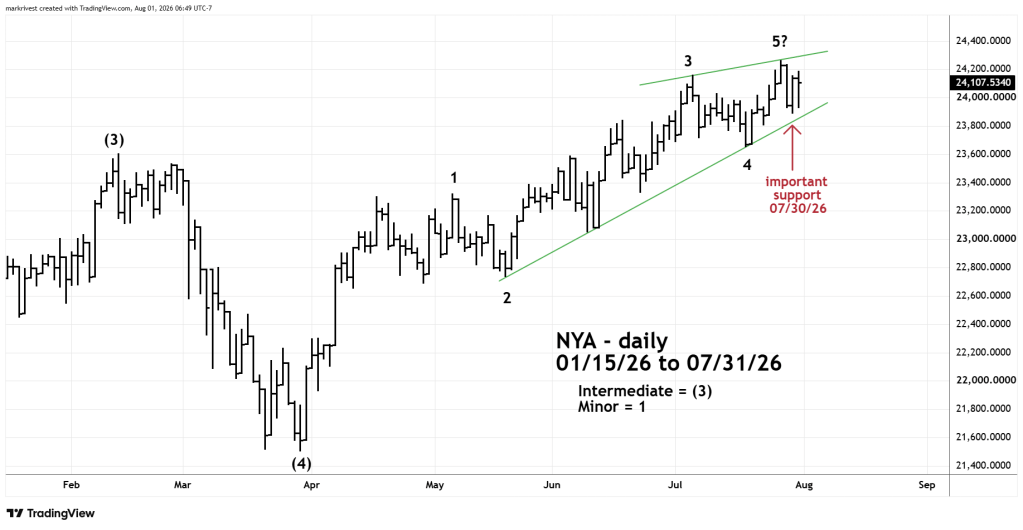
NYA move up from the late March 2026 bottom could be an Elliott wave – Ending Diagonal Triangle (EDT). The fourth wave of this structure almost always crosses over into the territory of the first wave. The key word is “almost”. The wave count illustrated could be a rare example in which wave “four” does not cross over into wave “one”.
Each of the sub waves of an EDT sub divide into three wave patterns or a combination of three waves. Please note the choppy nature of the presumed Minor waves “1” and “3” which is a characteristic for these waves in an EDT.
If the EDT is still developing there could soon be a brief throwover of the rising trendline. This phenomenon frequently occurs at EDT termination points.
A move below the 07/30/26 bottom could be a very bearish signal.
The next daily chart courtesy of StockCharts.com shows the NYSE – Advance/Decline (A/D) line symbol $NYAD.
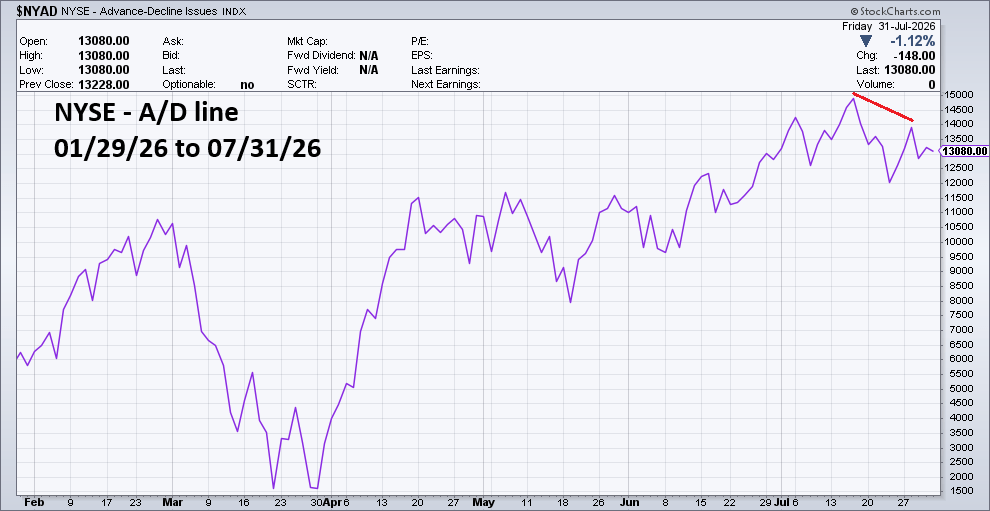
The NYSE – A/D line peaked on 07/16/26, the NYA all-time high was on 07/28/26. A bearish momentum divergence.
The Barchart.com daily chart illustrates NYSE – 52 – week highs since late January 2026.
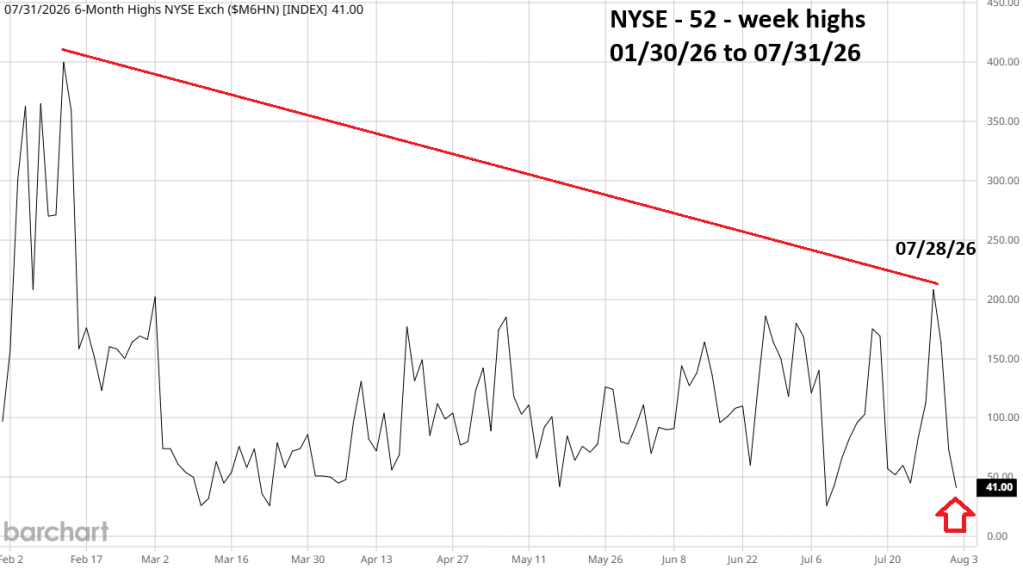
On 07/28/26 the 52 – week highs pushed above the peaks it made in June and July. However, it was far below the level reached in February 2026.
Even more bearish, 52 – week highs plunged on 07/30/26 and 07/31/26 while NYA rallied.
Sometimes markets can make significant turns on or near Full/New Moons plus or minus two trading days. The NYA all-time high was on 07/28/26 one day before a Full Moon and has since failed to make a new high.
Another factor could be in play. 08/03/26 is the first trading day of August. Perhaps after posting profitable records in July, stock fund managers may begin selling.


Two comments about the NYSE Composite cumulative A/D line. The first comment is that the preferred method of calculating the A/D line is using Barron’s daily A/D data. The reason that Barron’s data is preferred over other methods is that the Barron’s data reflects only common stock movements. No distortions that come from NYSE listings that are not individual stocks.
The second point is that negative divergences between the NYSE index and the cumulative A/D line that have preceded major turning points have historically been observed over significantly longer periods of time than the short time frame considered in this blog. And the meaningful negative divergence take place between the A/D line values taken from two NYSE Composite index peaks, as opposed to a divergence between the A/D line peak and the A/D Line value at the most recent NYSE Composite peak. If you compare the A/D line values between the July 6 peak and the July 28 peak, you will see that there is a bearish divergence, but it is not as pronounced as the divergence shown in the chart as highlighted using a red line.
LikeLike
Hi David
Thanks very much! This information is very helpful.
Mark
LikeLike