Sometimes markets can have significant turns on or near Full/New Moons plus or minus two – trading days.
There was a Full Moon on 07/29/26, On 07/28/26 the NYSE Composite (NYA) made an all-time high. However, this high could soon be exceeded.
The daily NYA chart courtesy of Trading View illustrates the action since late April 2026.
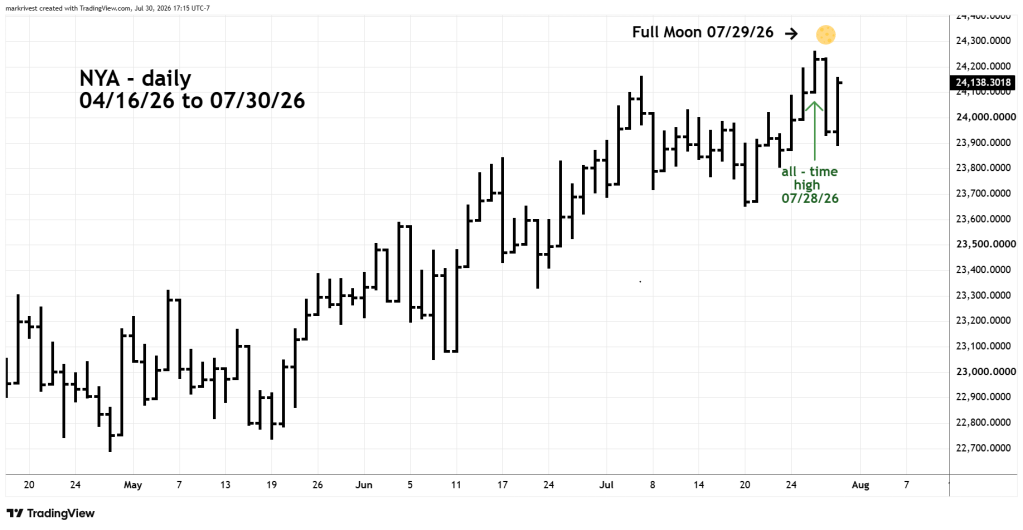
07/28/26 NYA high was unconfirmed by the Dow Jones Industrial Average, S&P 500, and Nasdaq Composite. The U.S. – FOMC short-term interest rate decision was on 07/29/26.
After the rate announcement U.S. stocks rallied then in the last hour of the 07/29/26 regular trading session there was a steep and dramatic decline.
The hourly NYA chart zooms in on what happened on 07/30/26.
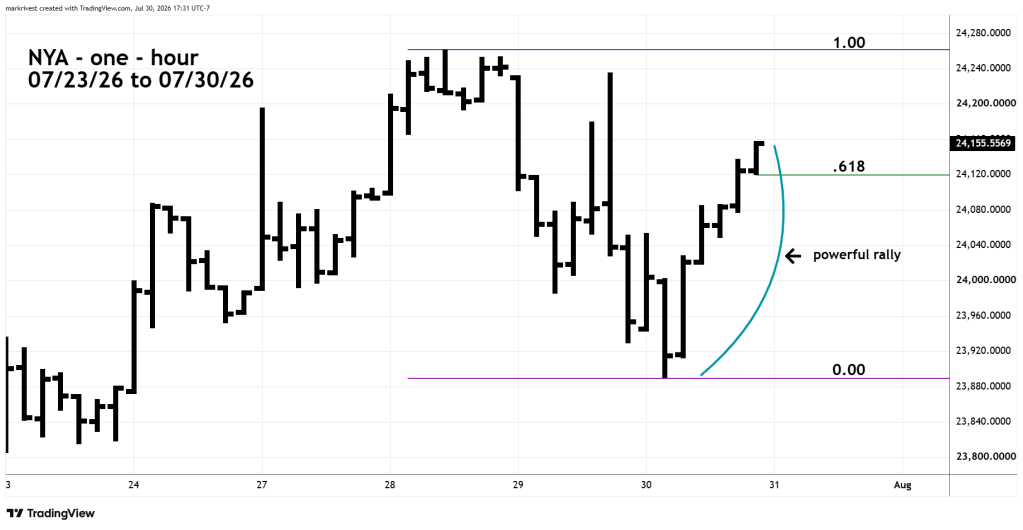
After such a strong drop late in the 07/29/26 session there should have been more downside action throughout the 07/30/26 session. The reverse occurred – U.S. stocks moved steadily higher during the session.
At the end of the 07/30/26 session NYA had retraced more than 62% of the decline since 07/28/26 and more than 75% of the post FOMC drop.
The persistent stock bull market could still be alive, new NYA highs could be made in the next few trading days.
Important support is the NYA – 06/30/26 bottom.
 Four Dimension Trading