S&P 500 (SPX) could be forming an Elliott wave – Ending Diagonal Triangle that could be the death of the bull market that began in April 2025.
The one – hour SPX chart courtesy of Trading View illustrates the intraday action since late May 2026.
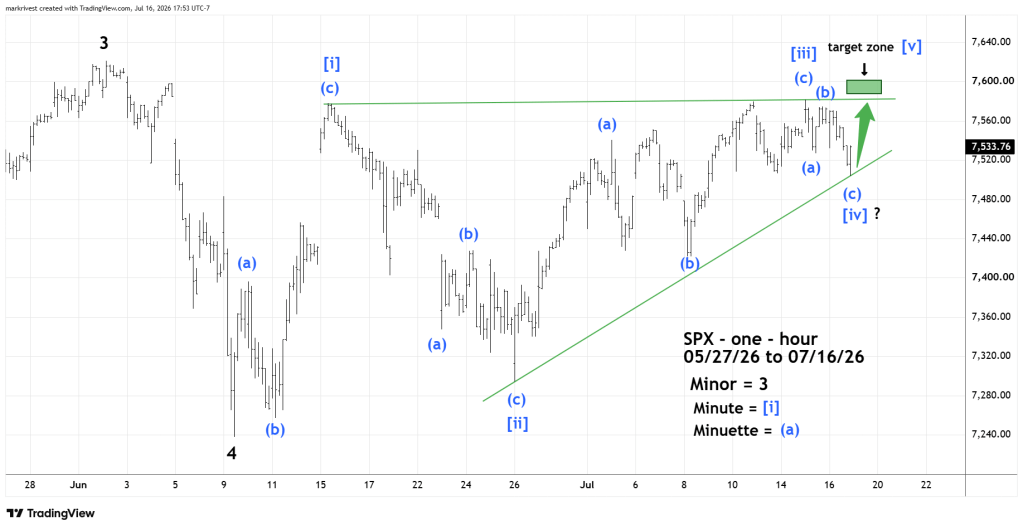
Elliott wave Ending Diagonal Triangles (EDT) are termination patterns that only appear in the fifth wave position of motive waves, and in the “C” wave position of corrective patterns. They are wedged shaped and the fourth wave of the pattern almost always crosses into the territory of the first wave. Each of the sub waves further divide into three waves or a combination of three waves. Frequently the fifth wave will have a brief throwover of the trendline connecting the termination points of the first and third waves.
This presumed EDT could terminate marginally above the 07/15/26 peak. This target is based on the shallow angle upper trendline connecting the Minute wave [i] and Minute wave [iii] peaks. Throwovers are usually brief; on an hourly chart it could be completed within the one – hour bar – therefore only a marginal move above the 07/15/26 peak.
The presumed EDT could be completed early in the 07/17/26 SPX session.

