An examination of two stocks participating in the AI and technology mania reveals fascinating data.
The first is Micron Technology Inc. (MU) which was last illustrated in the 05/30/26 blog “Micron Technology Inc. Upside Target”.
The weekly MU chart courtesy of Trading View updates the action.

There are always alternate Elliott wave counts. The 05/30/26 blog had the mid – May 2026 bottom at 652.21 as the presumed Intermediate wave (4). This bottom was the basis for a presumed significant MU peak at 1,014.18. As it turns out MU continued its relentless rally. In late May 2026 MU had risen 207% from its late March 2026 bottom. As of 06/25/26 MU had climbed an incredible 300% from the late March 2026 bottom!
The current chart illustrates the late March 2026 bottom at 311.49 as the presumed Intermediate wave (4). This wave count yields potential Fibonacci resistance at 1,216.64 the actual peak on 06/25/26 was 1,255.00; within leeway of the target.
Elliott wave segments can also have Fibonacci time relationships. In this case Intermediate wave (1) was 11 – weeks. The presumed Intermediate wave (5) has lasted 12 – weeks, close to the Fibonacci equality ratio.
The 05/28/26 blog “Massive Rally of Micron Technology Inc.” illustrated that the weekly RSI had a marginal bearish divergence vs. the January 2026 reading. As of late June, there is now a double bearish divergence.
The daily MU chart zooms in on recent activity.
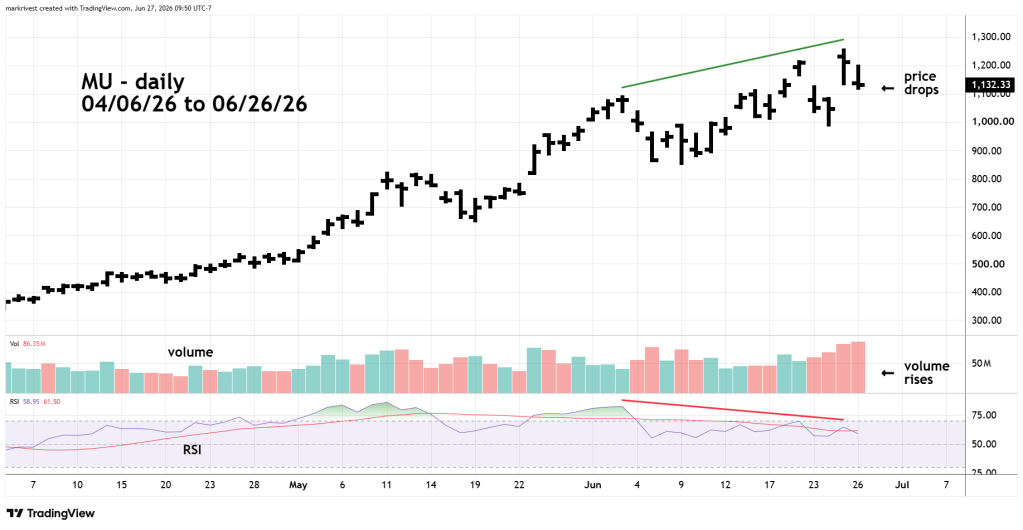
The daily MU chart zooms in on recent activity.
The MU price high on 06/25/26 was triggered by a bullish earnings report. Note the daily RSI also has a double bearish divergence. Also of interest is the action on 06/26/26, MU went down in higher volume than the prior day. Perhaps the bears are taking control.
The next weekly chart shows a smaller technology company, BlackBerry Limited (BB).

Since late March 2026 – BB has rallied 270%!
Even more amazing is the area it has reached. BB is close to Fibonacci .382 retrace of the bear market from January 2021 to August 2024. On 06/26/26 BB hit an exact Fibonacci .618 retrace of the decline after the May 2021 peak.
Two Fibonacci coordinates in proximity represents potentially powerful resistance.
Please note the weekly RSI bearish divergence.
The daily BB chart looks at the action since late April 2026.
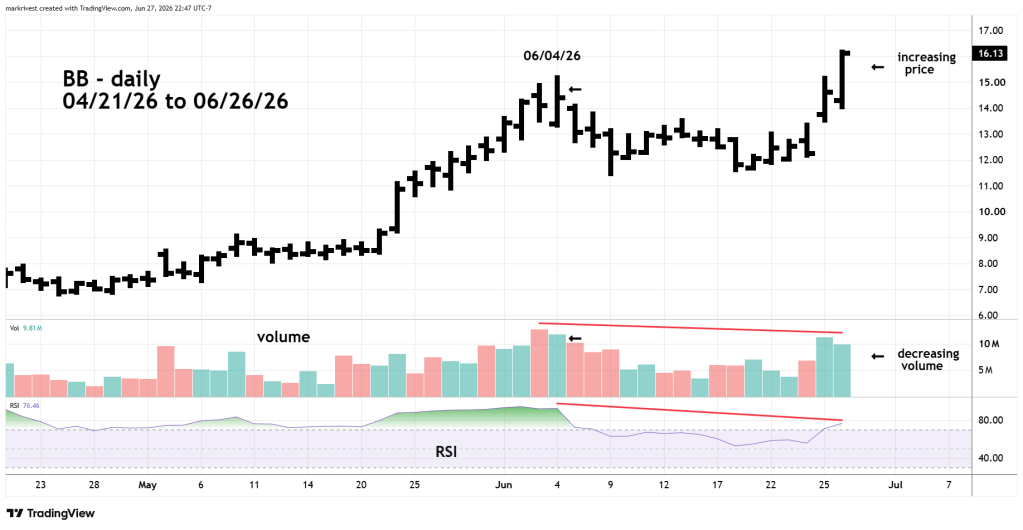
BB high on 06/26/26 came after a bullish earnings report. Daily RSI has a bearish divergence vs. the 06/04/26 reading.
The volume in general has decreased from the early June peak to the late June top.
Focusing on the last two trading days reveals the 06/26/26 peak was made at less volume than the prior trading day. This could be a sign the bulls are getting weaker. The same phenomenon occurred at the early June peak.
Both MU and BB appear poised for a decline. However, this is a Juxtaposition to the bullish Advance/Decline line data illustrated in this website’s prior blog.
Are the presumed bullish A/D lines a market fake out?
Will MU and BB immediately go to even higher levels?
We could have answers very soon.
