On 06/26/26 both the NYSE Composite Advance/Decline line and the S&P 500 Advance/Decline line made new all-time highs. This factor implies more upside action for both stock indices.
The daily NYSE Composite Advance/Decline line ($NYAD) courtesy of StockCharts.com illustrates its action over the last six months.
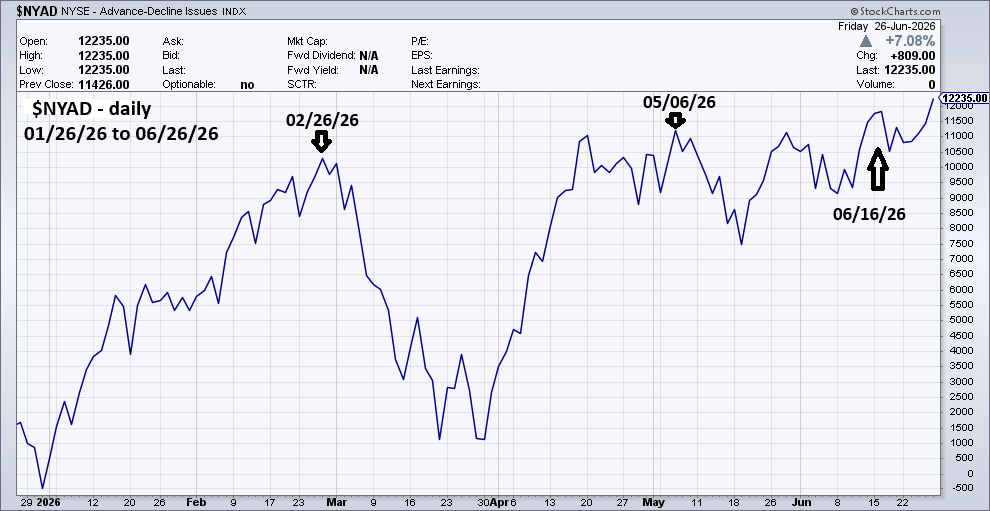
The pattern of the line for six months is series of higher highs and higher lows. A classic bullish formation.
The daily NYSE Composite (NYA) chart courtesy of Trading View shows when the Advance/Decline highs occurred.

Normally A/D highs occur before the price indices peak. In both February and May, the A/D highs happened after NYA peaks. This phenomenon is repeating on 06/26/26, the new A/D high is being made after the NYA top.
The next daily chart shows the S&P 500 – Advance/Decline line ($SPXADP) over the span of six months.

The pattern since February 2026 is a rising wedge. On price charts this is a bearish pattern, perhaps the A/D rising wedge is the prelude to a decline.
The daily S&P 500 (SPX) illustrates when it’s A/D highs happened.
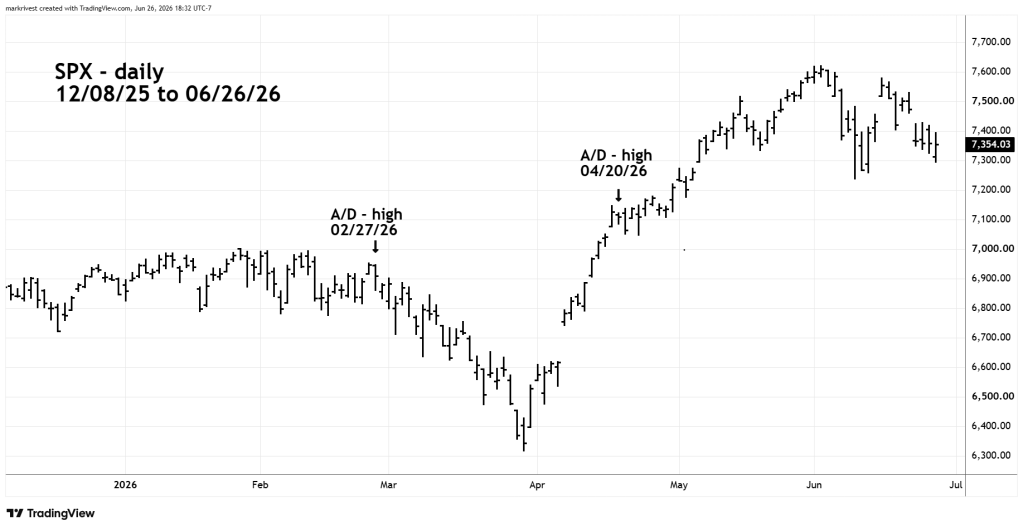
In February 2026 we again see the A/D line peak after the SPX January high point.
After the April A/D high – SPX continued to rise, this is normal A/D to price action. The SPX – A/D new high on 06/26/26 invalidates the April A/D bearish signal.
Within the next few trading days there’s a good chance both the SPX and NYA will make new all-time highs. If so, it must be viewed in the context of the larger picture.
The 06/20/26 blog “Sector Analysis of the S&P 500 – June 2026” illustrated that most S&P 500 – sectors are failing to make new highs. A sustainable stock market bull trend should have broad sector participation. This factor, plus the intense bullish sentiment in the Technology sector, are the ingredients for a multi-week or multi-month bear phase.
