The Market Vane Bullish Consensus is a contrarian sentiment indicator that tracks the buy and sell recommendations of market professionals. High percentage readings come near bull market peaks, low readings near bottoms.
For the S&P 500 readings, over 65% generally indicate a peak could be forming, 35% or lower signal an approaching bottom. Bullish consensus is not a precise indicator, and a presumably very high or low reading could be exceeded.
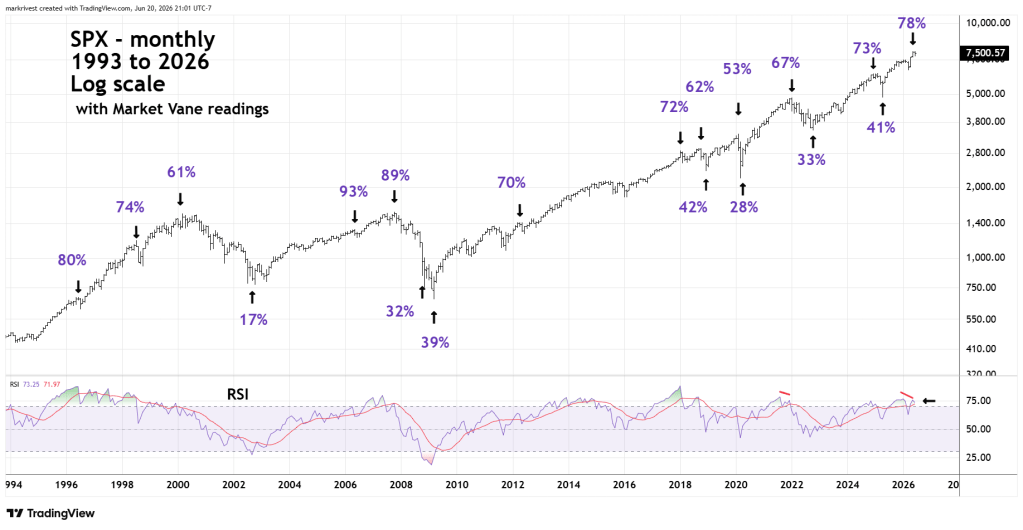
The Monthly S&P 500 (SPX) chart courtesy of Trading View illustrates important Market Vane readings over the prior thirty -years.
Please note what happened with the Market Vane readings prior to the three most significant bear markets since 1996.
The three bear markets were: 2000 to 2002.
2007 to 2009.
2020 Covid crash.
In each case before the major bear markets, Bullish Consensus readings decreased.
For example, the intermediate bull market in 1996 had an 80% reading. The 1998 top had a reading of 74%. When the ultimate peak was approaching in early 2000 the reading had declined to 61%. This is a long – term bearish sentiment divergence.
Now look at what’s been happening since the SPX intermediate top in 2022, the readings have increased. Early 2022 it was 67%. At the 2025 top it was 73%, and just recently reached 78%. The highest reading since 2007.
The SPX and the readings could of course continue to climb in the coming weeks. Market momentum argues strongly against this scenario. Note that in May 2026 monthly RSI had a bearish divergence vs. the January 2026 reading. This is like what happened in late 2021 just before the 2022 bear market.
This website’s prior blog illustrated bearish divergences among the SPX sectors.
And the 06/18/26 blog “Micron Technology Inc. Update – 06/18/26” illustrated a double bearish daily RSI divergence after the stocks twelve-week 271% gain!
Based on the long-term sentiment readings, if SPX is currently peaking it’s probably just an intermediate top. If so, a bear phase is likely to last months not years. Broad U.S. stock market seasonal patterns are bearish from May to October.
The target month for what could be an important bottom is October 2026.
