Bitcoin (BTCUSD) bull and bear markets roughly correspond with S&P 500 (SPX) bull and bear markets. If the SPX has just started a multi-month bear market BTCUSD could forecast the end of the bear market.
The monthly BTCUSD and SPX charts courtesy of Trading View illustrate their long-term relationship.
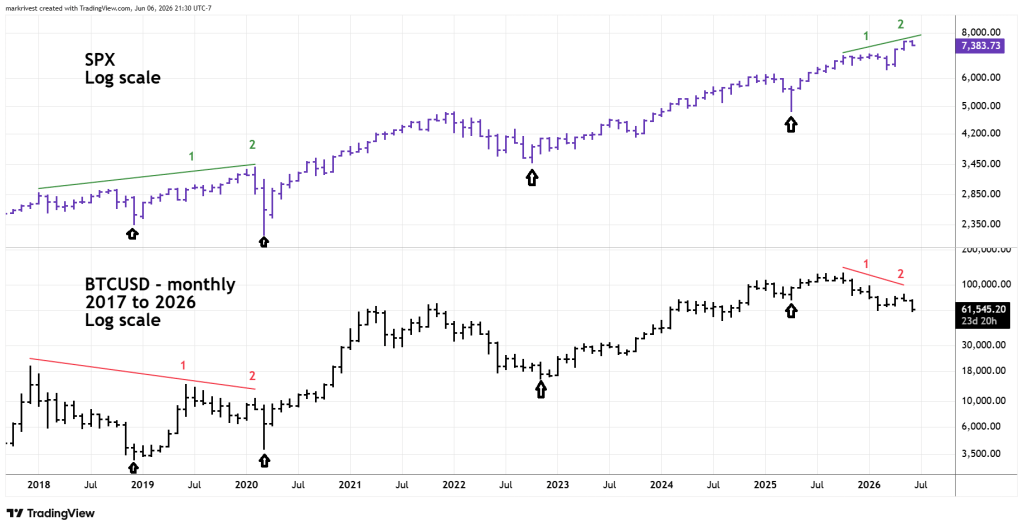
BTCUSD and SPX bear markets end at or close to the same time.
BTCUSD bull markets peak before the SPX bull market tops.
Note the phenomenon that occurred from 2017 to 2020. BTCUSD had two divergent rallies before the SPX final top in 2020. The same situation happened on a smaller scale from 2025 to the presumed final SPX peak in June 2026.
The BTCUSD monthly chart examines its prior bull and bear markets. An arithmetic scale chart is used to better illustrate Fibonacci retracement levels.

The BTCUSD bull market from 2018 to 2021 lasted 35 – months, followed by a 12 – month bear market. The bear phase broke below the Fibonacci .618 retracement of the bull market.
The orange line on the RSI indicates its lowest level of the 2021 to 2022 bear market. Note RSI flattened out for about 5 – months before making its ultimate low.
Now let’s look at the next bull market 2022 to 2025 which also lasted 35 – months. The current bear market is in its eighth month and is just above a Fibonacci .618 retracement of the bull market. Also note that RSI is currently at about the same level as it was in the 2021 to 2022 bear market, just before the flattening phase.
If the current BTCUSD bear market continues the same track as the 2021 to 2022 bear market, it could.
Last another 4 – months.
Go below the Fibonacci .618 retracement of the prior bull market.
Have RSI flattened out and go marginally lower.
If this scenario plays out both BTCUSD and SPX could make ultimate bear market bottoms sometime in October 2026.
