Since 04/07/25- Micron Technology Inc. (MU) has been in an extended Elliott impulse wave. The pattern is nearly complete.
The weekly MU chart courtesy of Trading View illustrates its rally since April 2025.
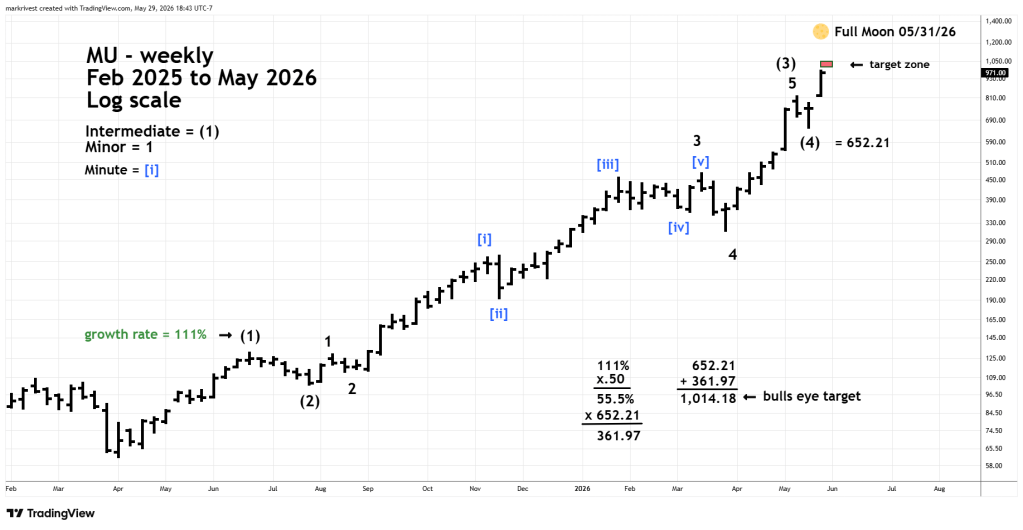
When using Elliott wave analysis on a market or stock with large percentage gains it’s more appropriate to compare growth rates rather than points gained.
Within Elliott motive patterns there’s usually a Fibonacci relationship between the first and fifth waves of the pattern.
The presumed Intermediate wave (1) had a growth rate of 111%, multiplied by the Fibonacci ratio of .50 equals 55.5%.
Adding a growth rate of 55.5% to the presumed Intermediate wave (4) bottom of 652.21 targets 1,014.18 as the termination point for Intermediate wave (5). This is the bulls eye Fibonacci target. There’s always leeway around Fibonacci targets; in this case the broad target zone is 1,010 to 1,050.
When this target zone is reached could depend on the Moon.
Sometimes markets or stocks could have trend changes at New/Full Moons plus or minus two trading days. These lunar trend changes are more likely to occur after a stock/market has experienced a large steep spike up or down. Since 03/31/26 – MU has risen an incredible 213%! This qualifies as a large spike up.
There’s a Full Moon on Sunday 05/31/26. Plus, or minus two trading days means that the high reached on 05/29/26 could be the ultimate peak. If not the Intermediate wave (5) termination point could occur on 06/01/26 or 06/02/26.
If MU completes five intermediate waves up from 04/07/25, the corrective decline is most likely to be in proportion in time/price to the thirteen – month bull move.
This implies a multi-month decline at least to the last significant support area, which in this case is the late March 2026 bottom.
From the peak made on 05/29/26 a decline of approximately 65%.

