The 05/23/26 blog “Dow Industrials – From Lagger to Leader” illustrated that on 05/22/26 only one of the three main U.S. indices; S&P 500 (SPX), Nasdaq Composite (IXIC), and Dow Jones Industrial Average (DJI) made an all-time high. The blog also noted “The potential bearish signal made on 05/22/26 will be invalidated if two of the main U.S. stock indices make simultaneous daily all-time highs”.
On 05/28/26 two of the main U.S. stock indices made all-time highs implying the broader U.S. market rally could continue.
Another factor in a potentially important U.S. stock market peak could be the performance of Micron Technology Inc. (MU).
The daily MU chart courtesy of Trading View illustrates its action since late March 2026.
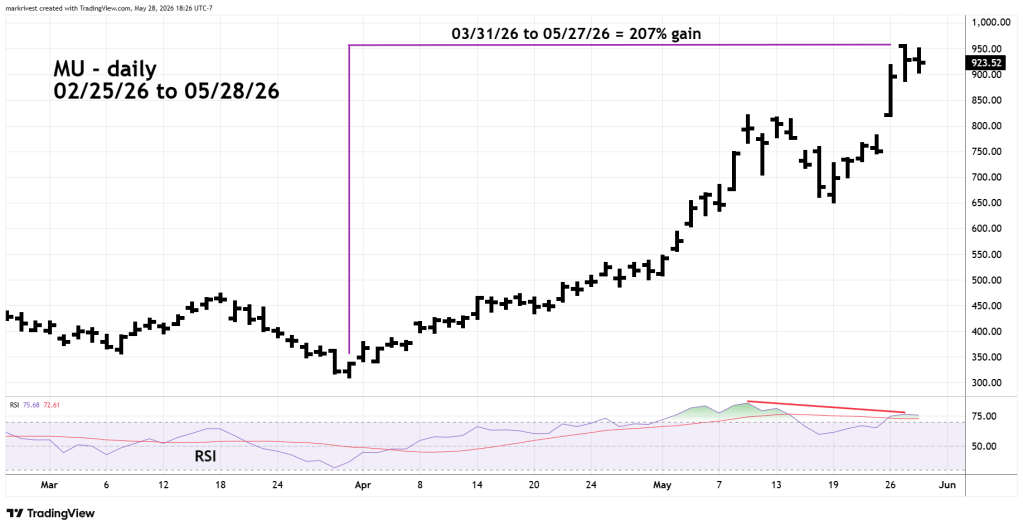
Since late March 2026: SPX has rallied 19%, IXIC rallied 30%, the Semiconductor ETF (SOX) has climbed 83%, MU has risen a mind blowing 207%!
Also note the 05/27/26 peak has a daily RSI bearish divergence.
The weekly MU chart shows the larger picture.
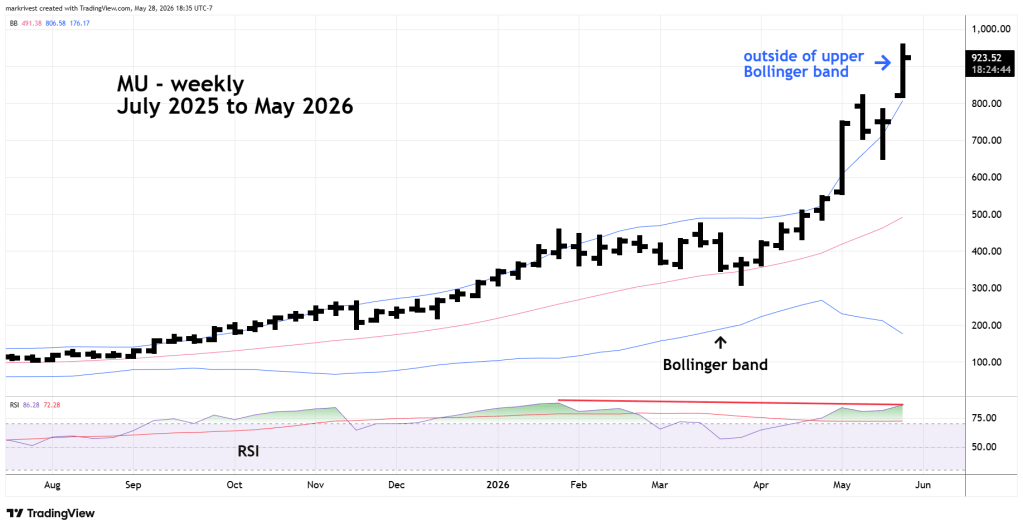
When a market or a stock is completely outside the upper Bollinger band it is usually a sign of a manic peak. So far, in the week of 05/26/26 to 05/29/26 – MU is outside the weekly upper Bollinger band.
Since late March 2026, technology stocks have led the U.S. stock market rally, with MU leading the technology sector.
An MU peak could coincide with a with a significant U.S. stock market top.

