The U.S. stock market rise since 03/30/26 has been relentless with only the tiniest of pullbacks. Of the three main U.S. stock indices, Nasdaq Composite (IXIC) has a 29% gain vs. S&P 500 gain of 19%, and Dow Jones Industrial Average 12%.
A look underneath the surface reveals a different picture.
The daily Nasdaq – 52 – week high chart ($MAHQ) courtesy of Barchart.com illustrates internal strength.
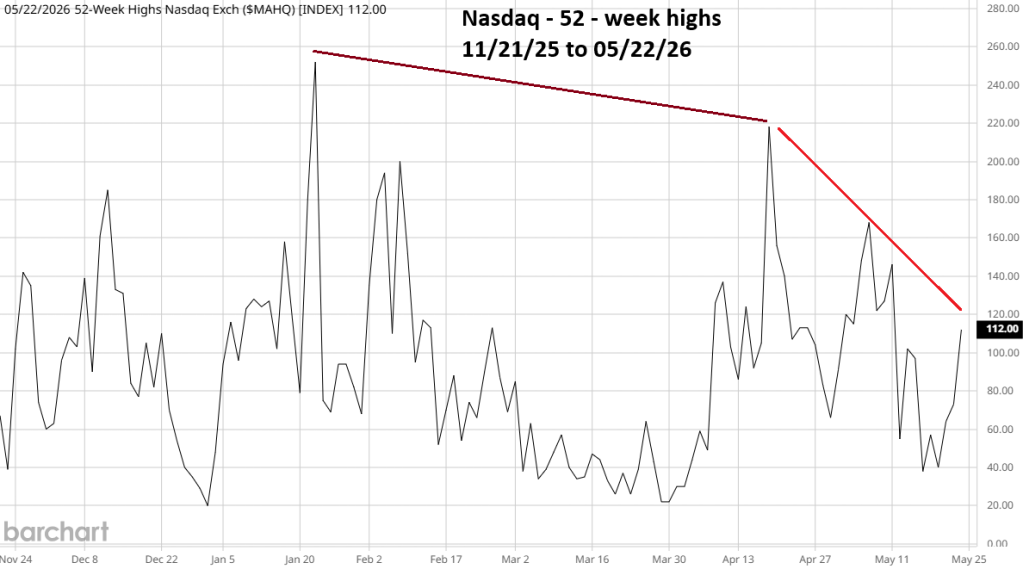
The maximum number of new highs for the post 03/30/26 rally occurred in mid – April and had a significant divergence vs. the maximum reading in late January. Subsequently the number of 52 – week highs has diminished.
The daily IXIC chart courtesy of Trading View put the 52 – week high readings in context with price action.
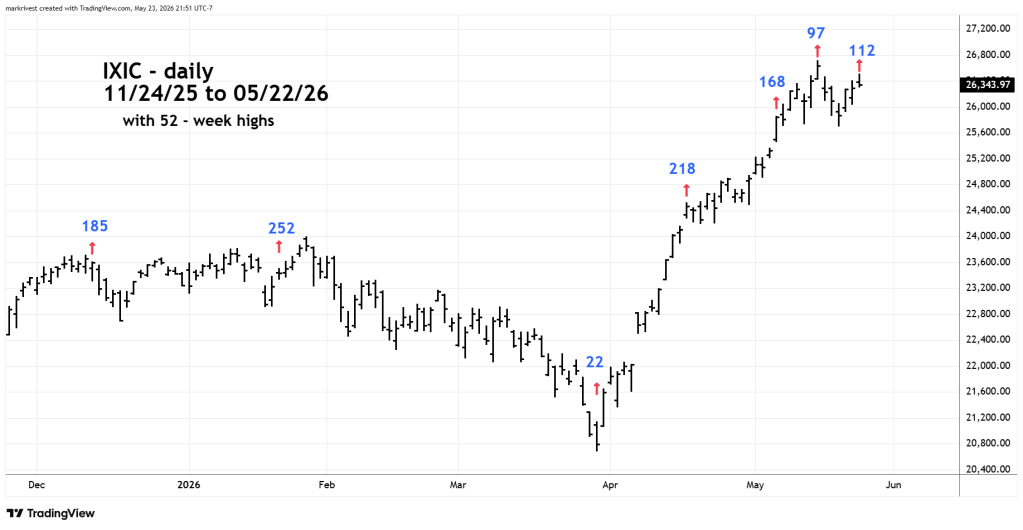
The price blastoff after 03/30/26 was impressive yet came with a considerable loss in strength from stocks making new highs vs. the January reading. After mid- April, the number of new highs continued to shrink.
The reading made on 05/22/26 of 112 new highs is a bullish divergence vs. the reading of 97 made on 05/14/26. This implies IXIC could soon reach new highs.
If the number of 52 – week highs continue to decline, at some point there won’t be enough stocks to maintain the index rally.
