The U.S. stock market rally since 03/30/26 has been steep and relentless and as of 05/15/26 appears likely to continue.
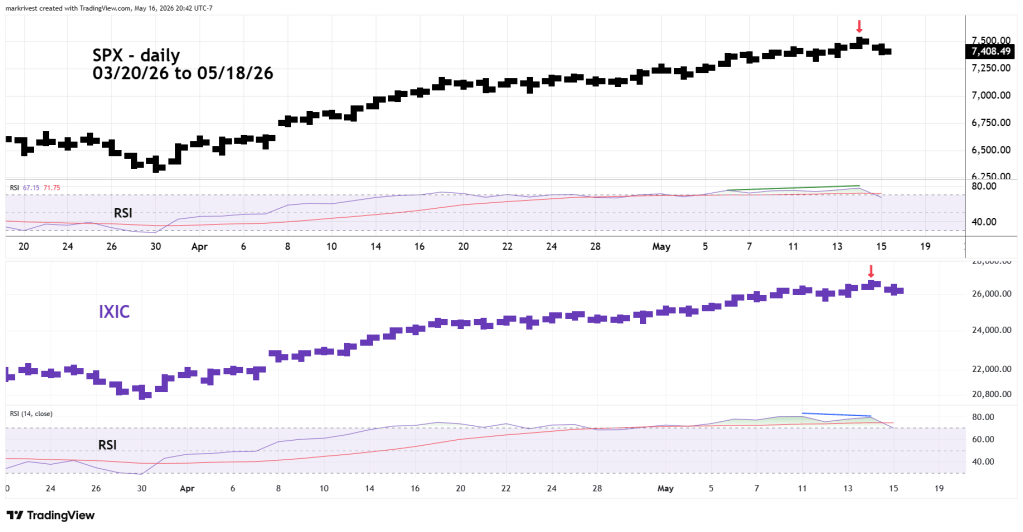
The daily S&P 500 (SPX) and Nasdaq Composite (IXIC) charts courtesy of Trading View examines two potentially bearish factors.
Several important U.S. stock market peaks since early 2000 have occurred when only one of the three main U.S. stock indices have made all-time highs unconfirmed by the other two main indices. The three main U.S. stock indices are, S&P 500, Nasdaq Composite and Dow Jones Industrial Average (DJI).
The solo peak phenomenon occurred in 2000, 2007, 2015, 2022, and February 2026. Early 2020 was the exception when both the SPX and IXIC peaked on the same day prior to the Covid crash. Solo peak divergences can be erased, which has happened in late 2025 and in 2026.
During the post 03/30/26 rally DJI has been the weakest index and is still below its February 2026 peak. Assuming this upside weakness continues, the focus is on SPX and IXIC. On 05/14/26 both SPX and IXIC reached all-time highs. If only one of the three main indices makes a solo-all-time high a potential peak could be reached.
Could an important peak be made with two or all three indices making new highs? Yes, it happened in early 2020 which was one out of six occurrences. Probabilities favor a solo index peak.
The other factor to watch is the SPX and IXIC daily RSI. Stock indices have a high probability of peaking with at least one bearish RSI divergence. On studies I’ve done there’s only about a ten percent chance of an indices price peak without an RSI bearish divergence.
As of 05/15/26 SPX had no daily RSI bearish divergence. IXIC has marginal RSI divergence. The ideal scenario to watch for is a solo index all-time high with a daily RSI bearish divergence.
The 30 – minute SPX chart focus is on the momentum of the post 03/30/26 rally.
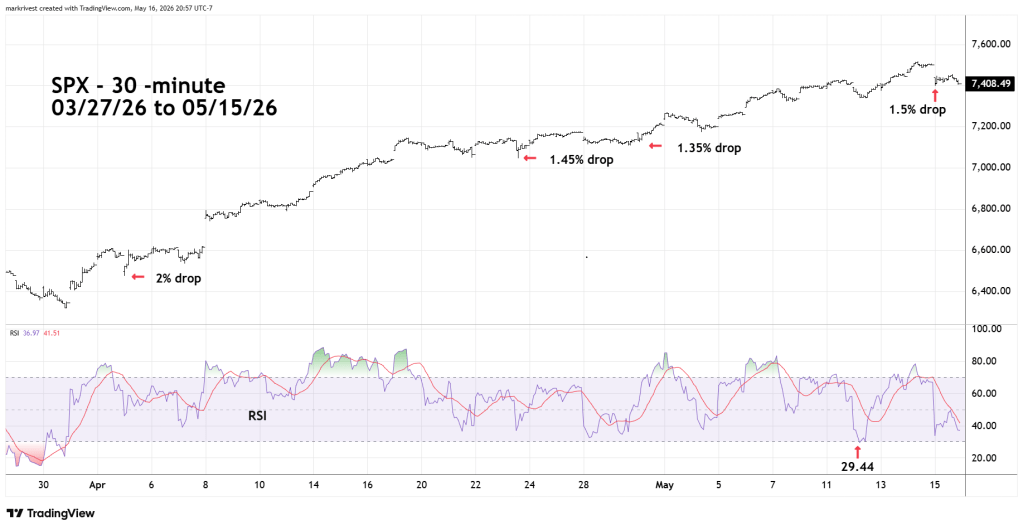
Since 03/30/26 the largest drop has been a meager two percent! The bears are being destroyed!
Also note the 30 – minute RSI which except for one marginal break has remained above the oversold zone.
Watch for an SPX – 30 – minute RSI move deep into the oversold zone below 30.00. This could be a subtle clue to a trend change. Either the prelude to a final price rally or the start of a possible multi-week price decline.
