On 05/15/26 the prices of U.S. Treasury – notes and thirty-year bonds declined.
When bond/note prices fall, bond/note yields rise.
The U.S. Treasury 30- year bond yields (TYX) are leading the way higher.
The weekly TYX chart courtesy of Trading View illustrates the long – term view.
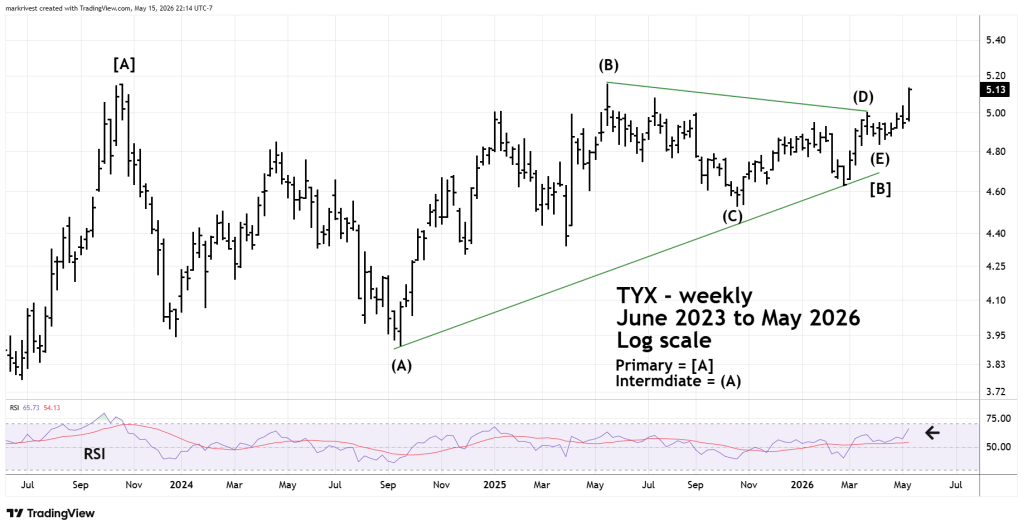
This is an update to the chart shown in the 04/26/26 blog “The Case for Higher U.S. Interest Rates – Part Two”. At the time it appeared the presumed Intermediate wave ( E ) could still be developing. There’s a high probability that Intermediate wave ( E ) terminated on 04/08/26. If so, it’s the end point of a multi – year Elliott wave – Horizontal Triangle.
After conclusion of these structures there’s usually a thrust in the direction of the main trend. The main trend for TYX since its major bottom in March 2020 has been up.
A move above the multi – year top at 5.15 could trigger at least a multi – week rally. Weekly RSI is below its overbought zone and implies more upside action.
A rise in U.S. interest rates/yields could have an adverse effect on the U.S. economy and stock market.
