The S&P 500 (SPX) could be in the final wave of a rally that began on 03/30/26.
The SPX 30 – minute chart courtesy of Trading View illustrates the intraday action.
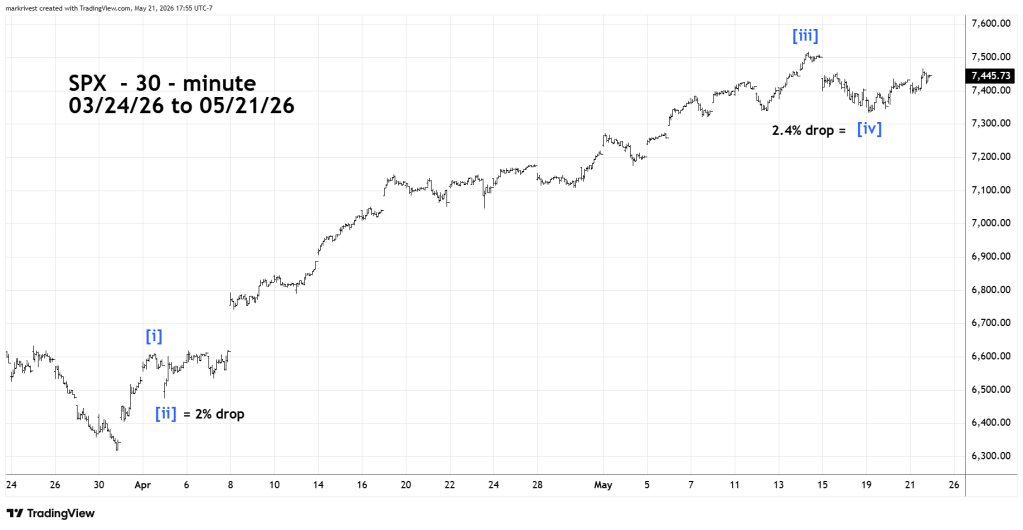
The 05/17/26 blog “Characteristics of a U.S. Stock Market Peak” noted that the SPX largest decline since 03/30/26 was only 2%. The most recent drop from 05/14/26 to 05/19/26 was 2.4%. Corrective waves “two” and “four” of Elliott Motive patterns tend to be equal or near equal in price. The decline into the bottom on 05/19/26 could be wave [iv] of a developing Elliott five wave pattern since 03/30/26.
If so, SPX could soon rally to a new all-time high.
The 05/17/26 blog also noted that significant U.S. stock market peaks can be signaled when only one of the three main U.S. stock indices makes a new all-time high unconfirmed by the other two main indices.
The three main U.S. stock indices are SPX, Dow Jones Industrial Average (DJI), and the Nasdaq Composite (IXIC).
Watch the three main stock indices, a solo daily all-time high of any of the three indices could be signaling an important turn.
