The 05/07/26 blog “The Fibonacci 1.618 – Solution” illustrated that the S&P 500 (SPX) had potential Fibonacci resistance at SPX 7,426. On 05/14/26 SPX reached 7,517, there’s always leeway around Fibonacci support/resistance levels. The high on 05/14/26 was 91 – points above the Fibonacci bullseye level – likely outside the leeway zone.
The doors open for more SPX rally, despite continuing internal bearish momentum. The SPX on 05/14/26 is above the level it reached on 05/08/26. During that time both the NYSE and S&P 500 – Advance/Decline lines went down.
Additionally, on 05/14/26 only one of the eleven State Street Select Sector ETFs was at an all-time high. The most bullish sector ETF is Technology – symbol (XLK). Perhaps the most bullish stock in that sector is Nvidia Corp (NVDA)
The daily NVDA chart courtesy of Trading View illustrates its action.
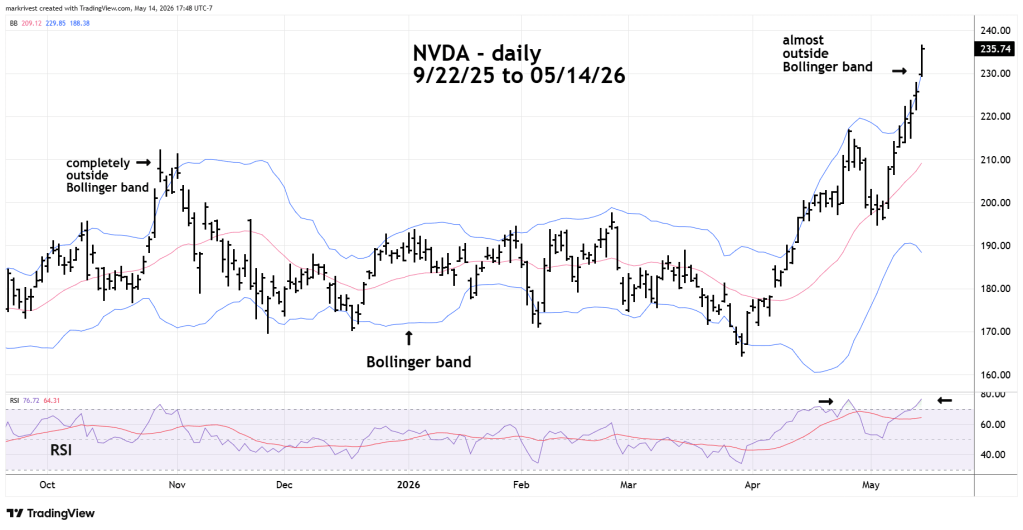
So far there’s no daily RSI bearish divergence, on 05/14/26 it reached 76%, matching the same level made on 04/27/26.
An early warning bearish signal could come on 05/15/26, if NVDA stays completely outside the upper Bollinger band. Please note what happened on 10/29/25 which was the first peak of a double top.
For several weeks the Technology sector has been leading the broader U.S. stock market.
Perhaps the “Nvidia” market could signal a bearish turn.
